


- Download PDF
- |
- Download Citation
- |
- Email a Colleague
- |
- Share:
-
- Tweet
-
Journal of Operative and Esthetic Dentistry
Volume 1, Issue 1, March 2016, Pages 1–5
MethodologyOpen Access
A portable confocal fiber optic raman spectrometer concept for evaluation of mineral content within enamel tissue
-
Anna Akkus1,*
 ,
Shan Yang2,
Ozan Akkus3,4 and
Lisa Lang1
,
Shan Yang2,
Ozan Akkus3,4 and
Lisa Lang1
*Corresponding author: Anna Akkus, Case Western Reserve University, School of Dental Medicine, 2124 Cornell Road, Cleveland, OH 44106-4905, USA. E-mail: asp7@cwru.edu
Received 1 December 2015 Revised 9 February 2016 Accepted 20 February 2016 Published 29 February 2016
DOI: http://dx.doi.org/10.14312/2398-029X.2016-1
Copyright: © 2016 Akkus A, et al. Published by NobleResearch Publishers. This is an open-access article distributed under the terms of the Creative Commons Attribution License, which permits unrestricted use, distribution and reproduction in any medium, provided the original author and source are credited.
AbstractTop
Objectives: Measurement of tooth enamel mineralization using a clinically viable method is essential since variation of mineralization may be used to monitor caries risk or in assessing the effectiveness of remineralization therapy. Fiber optic Raman systems are becoming more affordable and popular in context of biomedical applications. However, the applicability of fiber optic Raman systems for measurement of mineral content within enamel tissue has not been elucidated significantly in the prior literature. Materials and methods: Human teeth with varying degrees of enamel mineral content were selected. In addition alligator, boar and buffalo teeth which have increasing amount of mineral content, respectively, were also included as another set of samples. Reference Raman measurements of mineral content were performed using a high-fidelity confocal Raman microscope. The same set of samples were investigated by an OEM fiber optic Raman set up which was configured as a) non-confocal and b) confocal configurations to collect spectral information from similar locations investigated by the research-grade Raman microscope. The Raman spectroscopy measurements were compared to microcomputed tomography (micro-CT) observations. Results and conclusions: Analysis of human teeth by research grade Raman system indicated a 2-fold difference in the Raman intensities of V1 symmetric-stretch bands of mineral-related phosphate bonds and 7-fold increase in mineral related Raman intensities of animal teeth. Non-confocal fiber optic system failed to resolve the differences in the mineralization of human teeth. On the other hand, introduction of the in-line confocal module to the fiber optic system resulted in resolving the differences in mineral content for the two human teeth samples. These results indicate that the sampling volume of fiber optic systems extends to the underlying dentin and that confocal aperture modification is essential to limit the sampling volume to within the enamel. Portable Raman systems integrated with confocal fiber probe is promising for screening for enamel mineralization.
Keywords: enamel; mineral content; Raman spectroscopy
IntroductionTop
Enamel is the hardest and the stiffest tissue. It withstands chewing forces and protects the internal dentin and pulp. It is loaded in a complex fashion throughout the life cycle of an individual. Mineralization is an important property that positively correlates with the mechanical behavior of mineralized tissues such as bone [1, 2] and teeth [3, 4]. Dental enamel is 95% mineral and 1% organic compounds and 4-5% water by weight percentage [5]. A reduction in mineral content has direct consequences as far as dental ailments are concerned. For example, molar-incisor hypomineralization increases tooth sensitivity to food, drinks, and thermal changes as well as results in restoration failure [6]. Moreover, previous studies suggest a possible relationship between enamel mineral concentration and caries susceptibility [7-9].
Several authors have investigated enamel mineral content [10-14] using various characterization methods in the context of decay [8, 9] and demineralization/ remineralization processes [15, 16], age [17, 18] and disease [19, 20]. For example, an X-ray microtomographic study of mineral concentration distribution in deciduous enamel revealed large variations in both the levels and gradients of mineral concentration in deciduous molars [11]. X-ray microtomography was employed to measure site specific mineral density of hypomineralized enamel [13]. Microcomputed tomography (micro-CT) was used to investigate mineral densities as well as elemental content in different layers of healthy human enamel based on the age of the individual [10, 17]. However, such radiographic methods are limited to ex vivo laboratory conditions and destructive to the specimens.
An understanding of tooth enamel mineral content using a clinically viable method is essential since assessment of such variations may serve as an early predictor of a dental health, and may indicate high than average populational susceptibility to caries. Raman spectroscopy is one of the few methods which offers the opportunity to study enamel mineralization non-destructively in vivo [21, 22]. While Raman spectroscopy has been used to assess tooth mineralization, there are no studies that examined the enamel mineral content systematically vis a vis enamel mineral content of various animals as well as differentiation between of high mineralized and low mineralized enamel of different individuals. The current study employed a portable fiber optic Raman probe to identify the variations of enamel mineral content between individuals and animal controls with high and low mineralization of the enamel. Results of the fiber optic Raman system was compared to the results obtained by using a research-grade commercial Raman microscope. The study also developed a confocal fiber optic set up to confine the sampling volume to the enamel specifically and to eliminate interference from the dentin.
Materials and methodsTop
Sample preparation
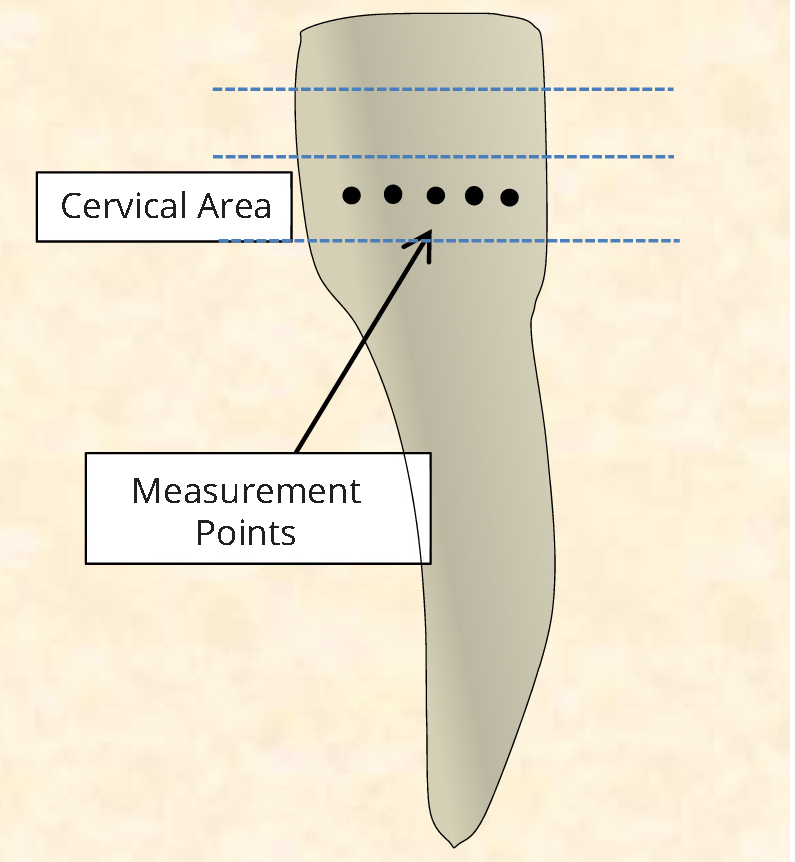
Human teeth were obtained in compliance with the National Institute of Health guidelines. The Institutional Review Board exemption was filed and approved (Protocol#: EM-13-17). Adult human incisors were extracted as a part of a normal treatment plan. The teeth were collected fresh within the date of the extraction and kept moist at all times without any additional disinfecting treatment. A dentist assessed the enamel of the specimens selected for Raman analysis in order to ensure that healthy intact enamel was evaluated. The samples were wrapped in wet tissue paper individually and stored in a -20°C freezer. Prior to Raman analysis the specimens were thawed at room temperature for 30 minutes while being wrapped in moist tissue paper. The crown of the tooth was measured with a ruler and the lower third of the tooth, cervical area was examined with various Raman spectrometers, Figure 1.
Animal teeth from alligator, boar and buffalo with various levels of enamel mineralization were also included as a phantom sample set. There is a considerable variation in mineralization of calcified tissues [23, 24] where the ash masses are ranging from 45% to more than 90%.
Raman spectroscopy
A high-fidelity confocal Raman microscope (Xplora, Horiba Jobin Yvon, NJ) was used to investigate the enamel mineral content. Measurements of this research-grade system constituted as a reference point to which the fiber optic systems’ measurements were compared to. The Raman microscope is composed of a laser source at 785 nm, and measurements were performed using a 1200 lines/mm grating, which provided a spectral dispersion of 0.8 cm-1 /pixel leading to 4 cm-1 spectral resolution. Labspec software was used for both acquiring the data and for performing background subtraction from the spectra.
The fiber optic Raman set up is constructed based on a 785 nm fiber laser (Innovative Photonic Solutions) with 100mW output power, a Raman spectrometer and a fiber probe combination (Wasatch Photonics, NC) as illustrated in Figure 2a. The thermo-cooled Raman spectrometer contained a high sensitive back-thinned CCD sensor (Hamamatsu S10420-1006, NJ) and a gelatin-based volume phase holographic transmission grating (Wasatch Photonics, NC) which enabled high optical throughput. The spectral resolution was 10 cm-1 with a spectral dispersion of 1.7 cm-1/pixel at 50 μm slit width. The laser light is transmitted through an optical fiber to the Raman probe which delivered the laser to the sample; the same fiber probe also collected the Raman signals from the sample and sent to the spectrometer through another fiber.
In an alternative configuration (Figure 2b), confocality was introduced to the fiber probe set-up to control the depth of signal collection volume. Confocality was attained by a set of lenses and a pin hole adjusted to a size of ~100 μm.
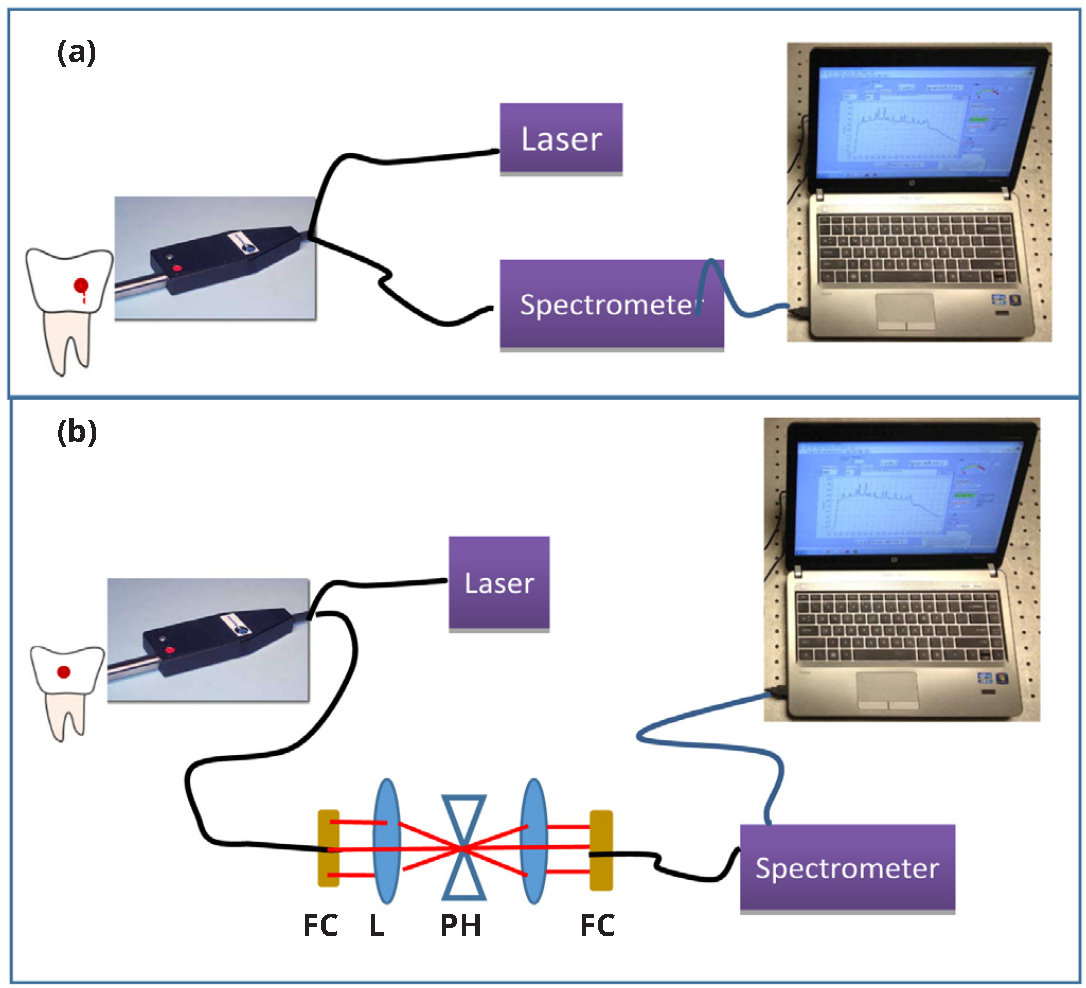
Abbreviations: L: lens, FC: Fiber collimator, PH: confocal pinhole.
In case of the custom made set up both the laser and Raman spectrometer were controlled by the Dash 2software, provided by Wasatch via USB connection to a laptop computer. Moreover, for each data point, the spectrum was taken with and without confocal adjustment by one second exposure with an average of 5 times. The acquired spectra were then processed to correct the fluorescence background using the following software, Labspec, Horiba Jobin Yvon. The intensities of background corrected spectra were measured at the phosphate symmetric stretch groups of the mineral phase at 960 cm-1 to quantify enamel mineral content. The mineral content was assessed based on the intensity of the 960 cm-1 peak of the phosphate [24, 25] symmetric stretch band.
Microcomputed tomography (micro-CT)
Raman spectroscopy based high and low mineralization scores were validated by μCT. Two teeth which had the high and the low mineral content values per Raman analysis were included for micro-CT assessment. Three-dimensional reconstructions of the teeth were obtained by using a micro-CT system (SkyScan 1172 Micro-CT, Micro Photonics Inc.). Both teeth were wrapped in wet gauze pad and stacked vertically in a cylindrical sample holder filled with water. Scanning both teeth simultaneously helped eliminate scan-to-scan variations. Scans were acquired at the following X-ray source of 80 kV, voxel size 16.6 μm 10W, 12-bit cooled CCD fiber-optically coupled to scintillator. The images were processed and reconstructed using NRECON software and raw-grayscale values reflecting mineralization levels were locally obtained at locations of the enamel close to where Raman measurements were taken.
Statistical analysis
Five samples per group were analyzed. Mann-Whitney U-test was conducted to compare the significant differences between groups. The obtained p values were less than 0.05 for all groups in question (p<0.05).
ResultsTop
Enamel mineral content have varied substantially between animal teeth (Figure 3) when it was evaluated with the research grade Horiba Jobin Yvon confocal microscope. The highest Raman based mineralization intensity was observed for the buffalo tooth which had 5-fold greater mineral content than the alligator tooth. Boar tusk had an intermediate level of mineralization. A similar trend of mineral content between animal teeth was also observed when the mineralization scores for the animal teeth were assessed with the non-confocal custom made set up (Figure 4a). The fold increase in mineralization between alligator and buffalo enamel as observed by the fiber optic set-up was 2.5-fold (Figure 4b).
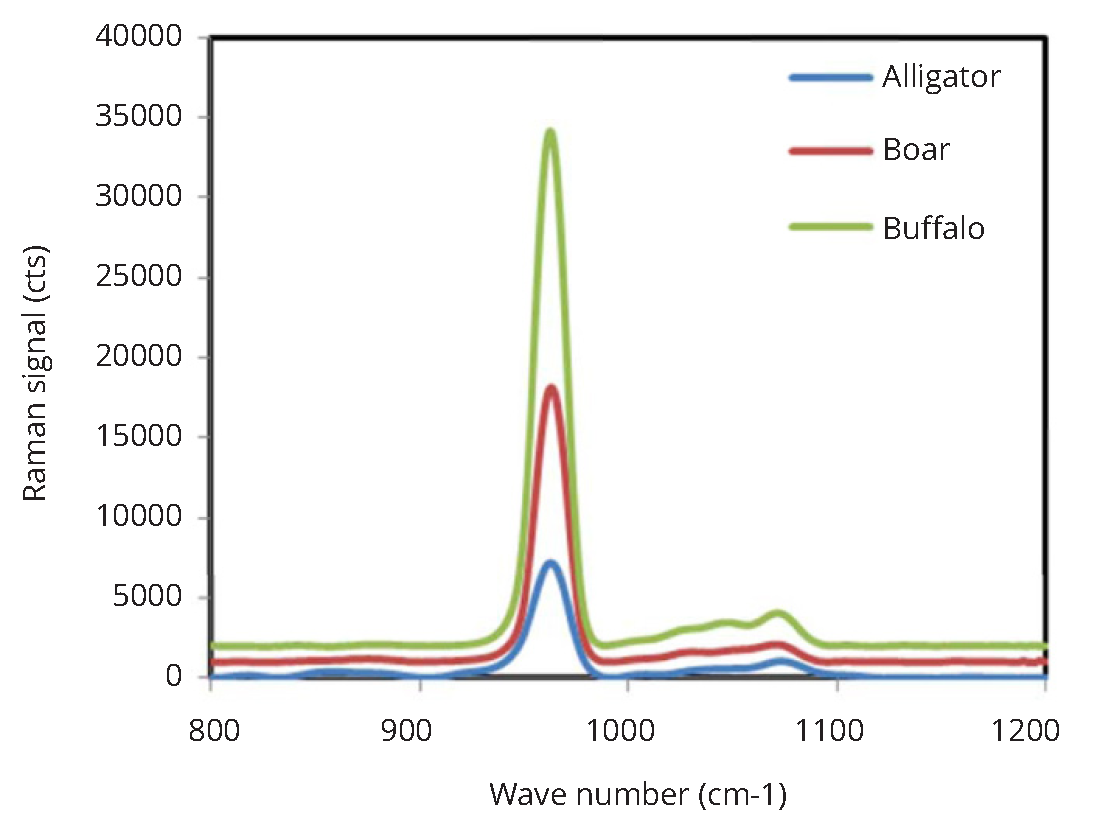
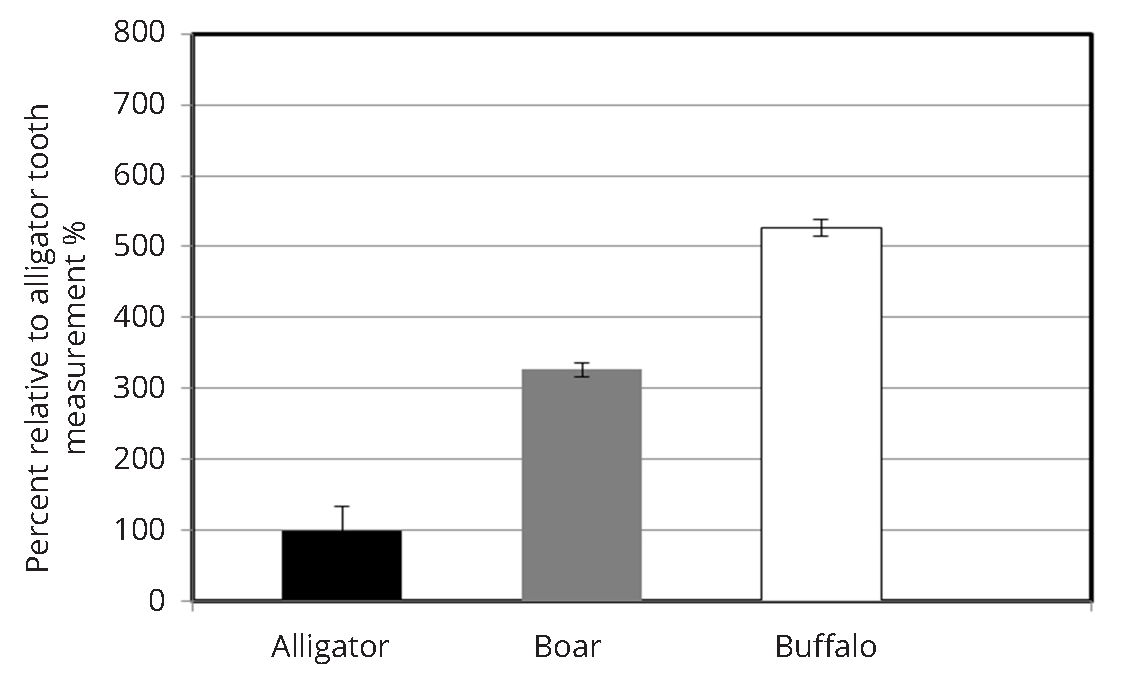
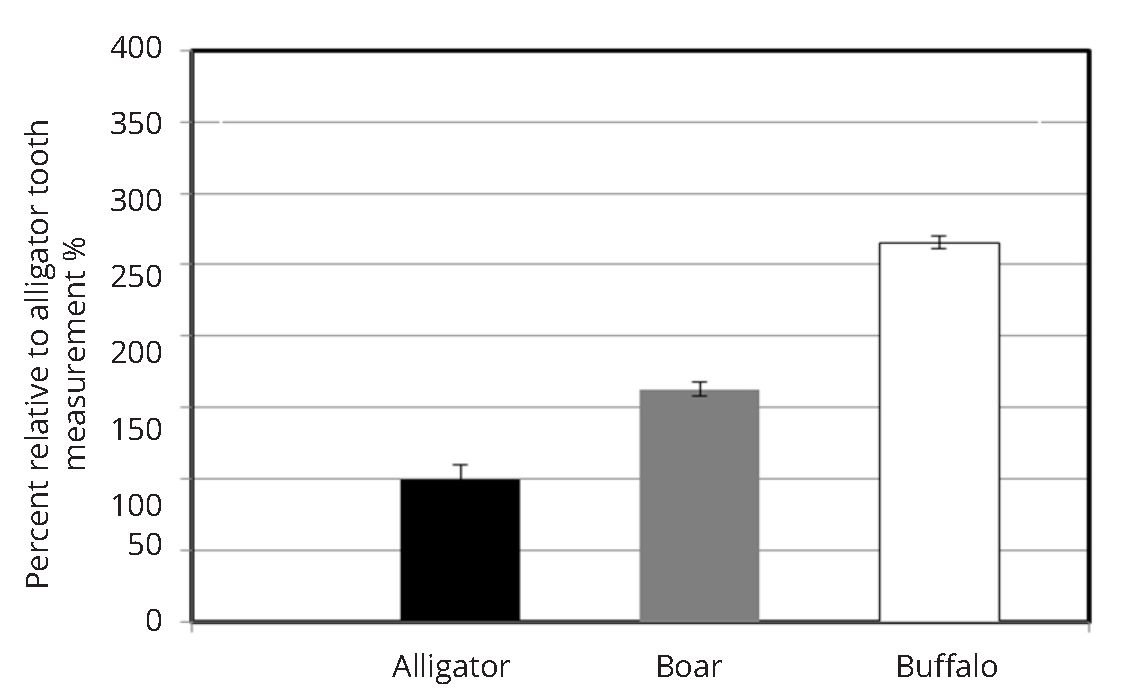
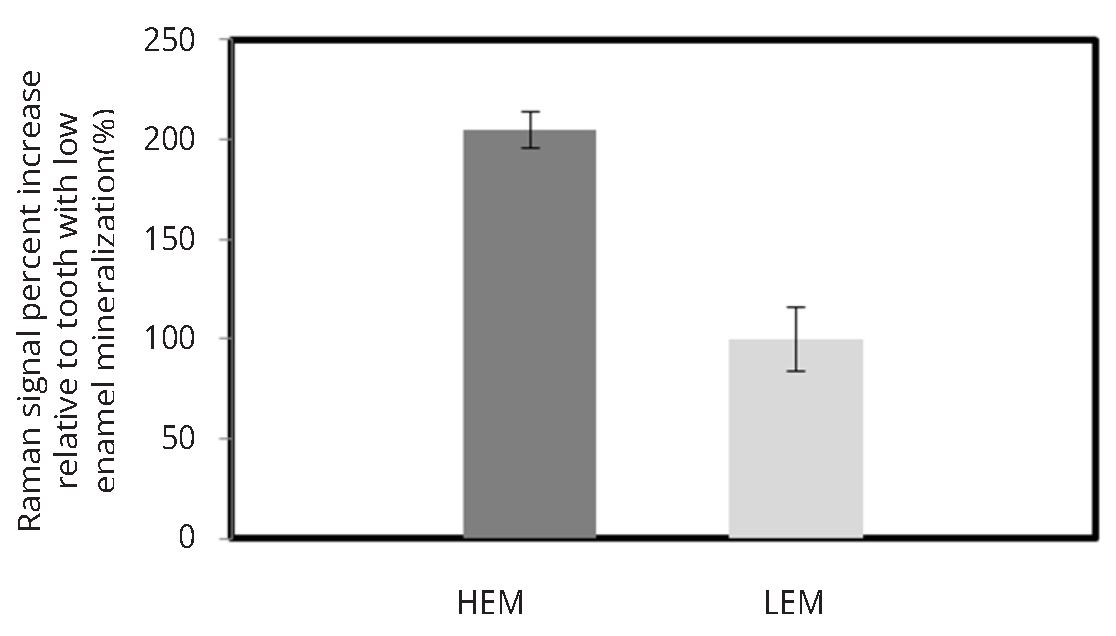
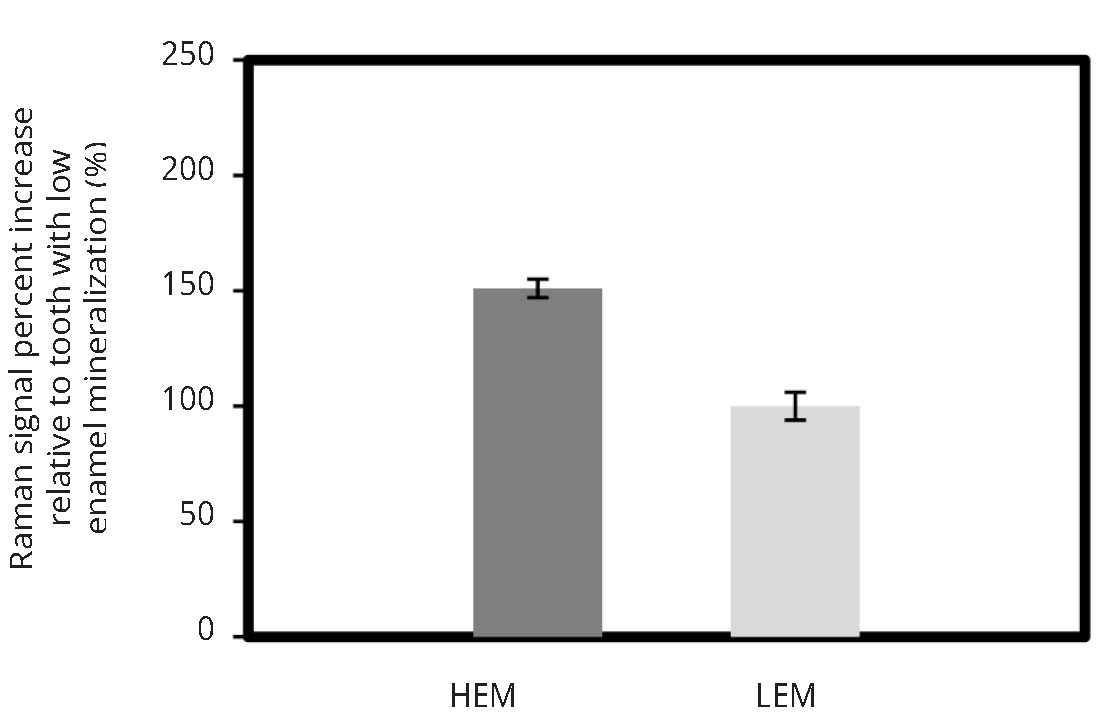
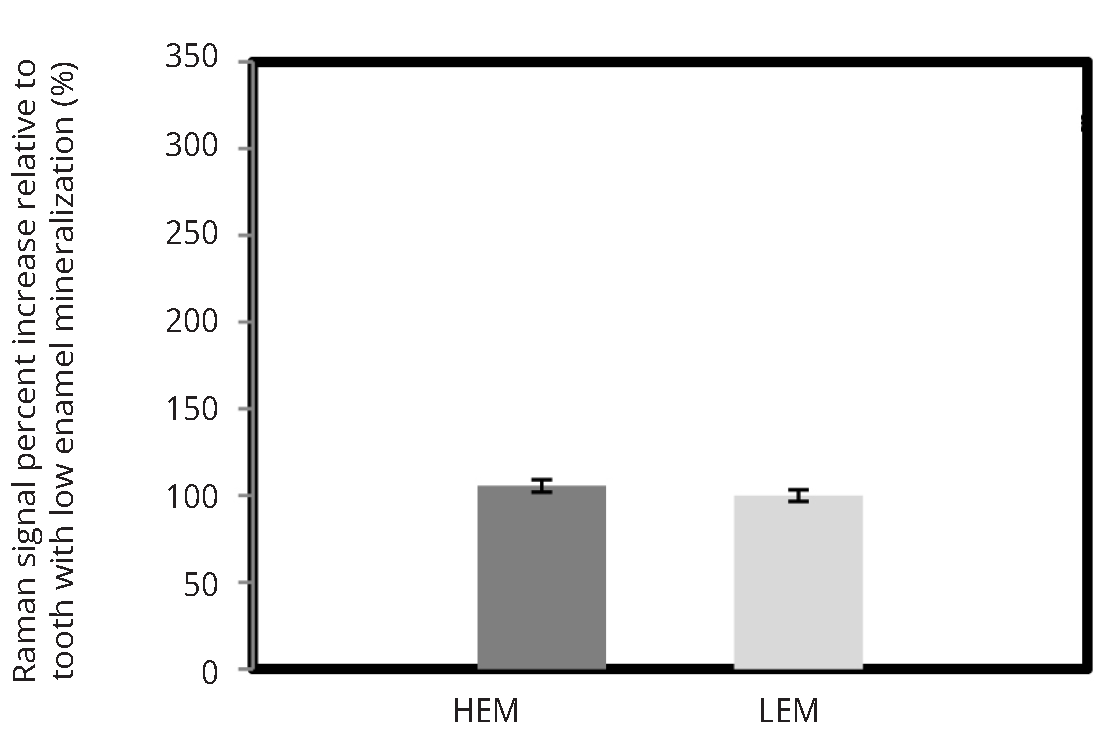
Figure 5 illustrates the mineralization score measurements obtained by using research-grade Raman microscope, custom made fiber optic setup as well as modified confocal fiber optic set-up for two human teeth with varying mineralization levels. Research-grade system demonstrated that one tooth had higher enamel mineral content (HEM) than the other tooth with low enamel mineralization (LEM) scores. The non-confocal set up shown in Figure 2a was not able to differentiate between the HEM and LEM teeth, however confocal modification to the portable Raman spectrometer allowed to identify high and low mineralized human teeth similarly to commercial JY Horiba system.
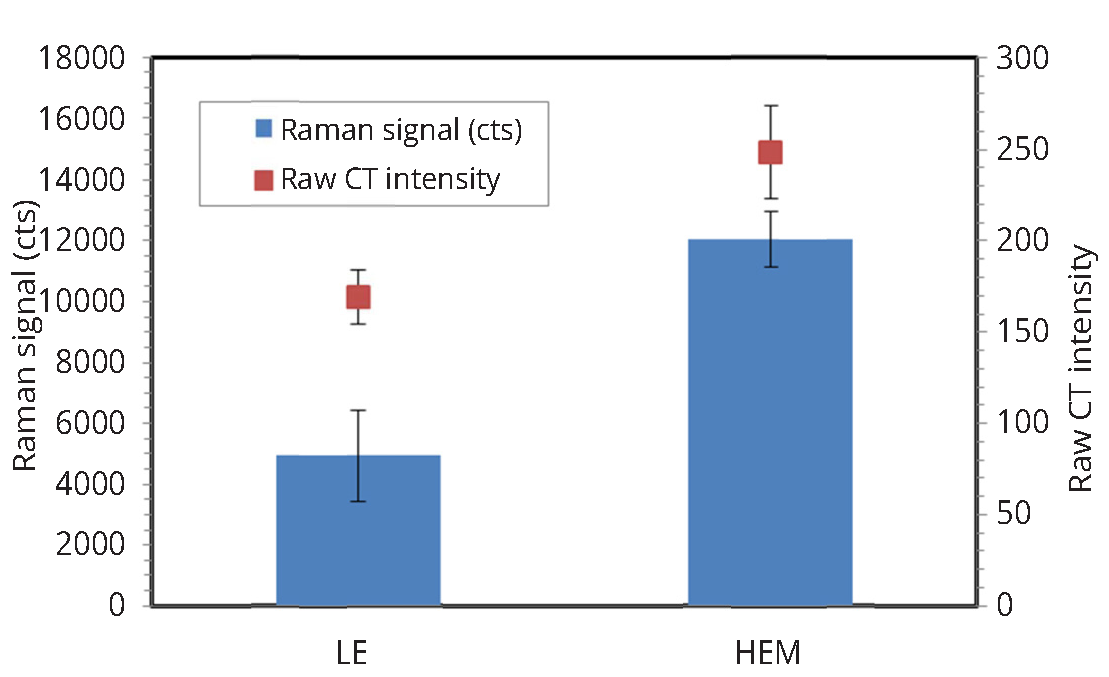
The micro-CT measurements of the two selected teeth with high (HEM) and low (LEM) mineralization scores confirmed Raman based observation Figure 6. The cervical portion of the tooth was compared in both instances. The LEM tooth showed similar to Raman low raw micro-CT intensity, where the HEM tooth exhibited higher raw micro-CT as well as Raman signal intensity indicative of higher then in LEM specimen enamel mineral content.
DiscussionTop
This is the first report to the best of our knowledge that put together a confocal fiber optic Raman system that was able to resolve variations in mineral content of the enamel per se. The enamel is order of magnitude thicker than biofilm; therefore, the Raman signal from enamel hydroxyapatite crystals dominated the spectrum and no biofilm related signal was observed in our data. However, in the future clinical application, when there is considerable amount of plaque formation, the tooth may need to be cleaned prior to conducting Raman measurements.
Others have reported image maps of mineralization on individual teeth using research grade systems. They have not demonstrated the need for confocality for resolving the enamel compartment and also have shown that mineralization levels may differ substantially between different teeth. Existing fiber optic Raman systems in analysis of teeth have not focused on mineralization, rather, they have investigated the uniformity of enamel crystal orientation by polarized Raman analysis to detect caries by assessing irregularities in crystal quality.
We used research grade confocal system as the reference for mineralization measurement. Raman has been standard in the literature of mineralized tissues for mineralization assessment [22, 24, 25]. Future studies will require formal measurements of mineralization, such as calcium content by back scattered electron microscopy or ash content analysis to calibrate the Raman intensities of the confocal fiber optic system with direct measurements of mineralization. Future studies are also needed to quantify the depth of penetration of the laser by varying confocality.
It has been suggested that the lower mineral concentration may be translated into increased porosity and is possibly linked to higher caries susceptibility [8, 9]. In addition, some studies [7, 8] hypothesized that mineral concentration may be a factor determining rate of demineralization/remineralization as well. Epidemiological studies demonstrate that children from lower social background have higher caries rate [9]. It is unknown whether enamel mineral content also plays a role in the greater caries risk in this population. Other effectors of enamel mineral content are poor oral hygiene, alcohol consumption and high intake of dietary carbohydrates. An early identification of the individual with overall low mineralization of the enamel may be a valuable screening tool in determining a group with much higher than average caries risk, allowing intervention before development of caries.
ConclusionTop
This is the first report to indicate a possibility of using affordable, clinically relevant, portable Raman spectrometer to assess the mineral content of tooth enamel. The results indicate a possibility of differentiation between low and high mineral content with use of confocality within portable Raman Spectrometer.
Conflicts of interest
Authors declare no conflicts of interest.
ReferencesTop
[1]Leichter I, Margulies JY, Weinreb A, Mizrahi J, Robin GC, et al. The relationship between bone density, mineral content, and mechanical strength in the femoral neck. Clin Orthop Relat Res. 1982; (163):272–281.Pubmed
[2]Hodgskinson R, Currey JD, Evans GP. Hardness, an indicator of the mechanical competence of cancellous bone. J Orthop Res. 1989; 7(5):754–758.Pubmed
[3]Kinney JH, Balooch M, Marshall SJ, Marshall GW Jr, Weihs TP. Hardness and young's modulus of human peritubular and intertubular dentine. 1996; 41(1):9–13.Article Pubmed
[4]Kodaka T, Debari K, Yamada M, Kuroiwa M. Correlation between microhardness and mineral content in sound human enamel (short communication). Caries Res. 1992; 26(2):139–141.Article Pubmed
[5]Baldassarri M, Margolis HC, Beniash E. Compositional determinants of mechanical properties of enamel. J Dent Res. 2008; 87(7):645–649.Article Pubmed
[6]William V, Burrow MF, Palamara JE, Messer LB. Pediatric dentistry Microshear bond strength of resin composite to teeth affected by molar hypomineralization using 2 adhesive systems. Pediatr Dent. 2006; 28(3):233–241.Article Pubmed
[7]Gerdin PO, Astrand K. Enamel roentgen density. I. Enamel roentgen density in deciduous teeth from six-year-old children with and without caries prevalence. Sven Tandlak Tidskr. 1969; 62(12):805–814.Pubmed
[8]Shellis RP. Relationship between human enamel structure and the formation of caries-like lesions in vitro. Arch Oral Biol. 1984; 29(12):975–981.Article Pubmed
[9]Targino AG, Rosenblatt A, Oliveira AF, Chaves AM, Santos VE. The relationship of enamel defects and caries: a cohort study. Oral Dis. 2011; 17(4):420–426.Article Pubmed
[10]He B, Huang S, Zhang C, Jing J, Hao Y. Mineral densities and elemental content in different layers of healthy human enamel with varying teeth age. Arch Oral Biol. 2011; 56(10):997–1004.Article Pubmed
[11]Wong FS, Elliott JC, Davis GR, Anderson P. X-ray microtomographic study of mineral distribution in enamel of mandibular rat incisors. J Anat. 2000; 196(Pt 3):405–413.Article Pubmed
[12]Wong FS, Anderson P, Fan H, Davis GR. X-ray microtomographic study of mineral concentration distribution in deciduous enamel. Arch Oral Biol. 2004; 49(11):937–944.Article Pubmed
[13]Farah RA, Swain MV, Drummond BK, Cook R, Atieh M. Mineral density of hypomineralised enamel. J Dent. 2010; 38(1):50–58.Article Pubmed
[14]Jeng YR, Lin TT, Wong TY, Chang HJ, Shieh DB. Nano-mechanical properties of fluoride-treated enamel surfaces. J Dent Res. 2008; 87(4):381–385.Article Pubmed
[15]Efeoglu N, Wood D, Efeoglu C. Microcomputerised tomography evaluation of 10% carbamide peroxide applied to enamel. J Dent. 2005; 33(7):561–567.Article Pubmed
[16]Efeoglu N, Wood DJ, Efeoglu C. Thirty-five percent carbamide peroxide application causes in vitro demineralization of enamel. Dent Mater. 2007; 23(7):900–904.Article Pubmed
[17]He B, Huang S, Jing J, Hao Y. Measurement of hydroxyapatite density and Knoop hardness in sound human enamel and a correlational analysis between them. Arch Oral Biol. 2010; 55(2):134–141.Article Pubmed
[18]Zheng Q, Xu H, Song F, Zhang L, Zhou X, et al. Spatial distribution of the human enamel fracture toughness with aging. J Mech Behav Biomed Mater. 2013; 26:148–154.Article Pubmed
[19]Atar M, Davis GR, Verry P, Wong FS. Enamel mineral concentration in diabetic rodents. Eur Arch Paediatr Dent. 2007; 8(4):195–200.Article Pubmed
[20]Koehne T, Marshall RP, Jeschke A, Kahl-Nieke B, Schinke T, et al. Osteopetrosis, osteopetrorickets and hypophosphatemic rickets differentially affect dentin and enamel mineralization. Bone. 2013; 53(1):25–33.Article Pubmed
[21]Ko AC, Hewko M, Sowa MG, Dong CC, Cleghorn B, et al. Early dental caries detection using a fibre-optic coupled polarization-resolved Raman spectroscopic system. Opt Express. 2008; 16(9):6274–6284.Article Pubmed
[22]Okagbare PI, Esmonde-White FW, Goldstein SA, Morris MD. Development of non-invasive Raman spectroscopy for in vivo evaluation of bone graft osseointegration in a rat model. Analyst. 2010; 135(12):3142–3146.Article Pubmed
[23]Currey JD. Effects of differences in mineralization on the mechanical properties of bone. Philos Trans R Soc Lond B Biol Sci. 1984; 304(1121):509–518.Article Pubmed
[24]Yerramshetty JS, Akkus O. The associations between mineral crystallinity and the mechanical properties of human cortical bone. Bone. 2008; 42(3):476–482.Article Pubmed
[25]Akkus O, Polyakova-Akkus A, Adar F, Schaffler MB. Aging of microstructural compartments in human compact bone. J Bone Miner Res. 2003; 18(6):1012–1019.Article Pubmed
 Copyright
© 2012-2025 NobleResearch Group. All Rights Reserved
Copyright
© 2012-2025 NobleResearch Group. All Rights Reserved