


- Download PDF
- |
- Download Citation
- |
- Email a Colleague
- |
- Share:
-
- Tweet
-
Journal of Radiology and Imaging
Volume 1, Issue 4, October 2016, Pages 20–28
Original researchOpen Access
The value of radiometry in sex assessment of bone fragments: A study on the radius in a modern Greek population
-
Elena F. Kranioti1,2,*

*Corresponding author: Elena F. Kranioti, Edinburgh Unit for Forensic Anthropology, University of Edinburgh, 4 Teviot place, EH8 9AG, Edinburgh, UK; E-mail: Elena.Kranioti@ed.ac.uk
Received 17 June 2016 Revised 25 August 2016 Accepted 15 September 2016 Published 26 September 2016
DOI: http://dx.doi.org/10.14312/2399-8172.2016-6
Copyright: © 2016 Kranioti EF, et al. Published by NobleResearch Publishers. This is an open-access article distributed under the terms of the Creative Commons Attribution License, which permits unrestricted use, distribution and reproduction in any medium, provided the original author and source are credited.
AbstractTop
Objectives: This paper highlights the different applications of Digital Radiology in forensic sciences and proposes an alternative sex estimation method based on digital radiographs of the proximal and distal epiphysis of the radius. Methods: A total of 101 (53 males and 48 females) adult left radii was used in this study. A digital portable X-ray machine (Technix TCA 4R PLUS) was used for taking the radiographs of the radii. Eight landmarks are selected on the radiograph of the proximal and six on the radiographs of the distal epiphysis generating in total 28 linear distances for the proximal and 15 for the distal epiphysis. Data acquisition was carried out using TpsUtil and TpsDig2 software and SPSS 19 was used for statistical analysis. Results: ANOVA detected 24 variables that differed significantly between males and females (p < 0.05). The best single discriminatory variable yielded 85% correct classification of the original sample. The best multivariate formula gave 88% correct classification of the original sample. More than half of the cases were correctly classified with 95% probability of correct classification. Conclusions: The study proposes the use of a rapid easy and inexpensive method for sex screening of forearm fragments based on digital radiographs of the radius. Results indicate that the proposed method can be used in addition to osteometric methods for sex estimation. This can be particularly advantageous in cases of mass disasters with numerous mutilated and/or burnt bodies where time is of crucial importance in forensic identification and maceration is not an option. It must be stressed here that the data derive from a documented sample of a modern Greek population thus it should not be considered applicable to other populations without previous validation studies.
Keywords: forensic anthropology; sex estimation; digital radiography; radius; discriminant function analysis; cretan collection
Research highlightsTop
- The use of Medical Imaging Technology in Forensic Science is long acknowledged. A sex estimation method based on digital radiographs of the radius is proposed here.
- Univariate and multivariate discriminant functions are generated resulting in up to 88% accuracy for a contemporary Greek population.
- This a rapid, easy and inexpensive method for sex screening of forearm fragments based on digital radiographs of the radius recommended for fragmentary commingled situations.
IntroductionTop
Forensic Radiology is a sub-specialization of Forensic Medicine defined as the discipline that “utilises the interpretation of medical radiological examinations to answer legal questions” [1]. The importance of radiographic methods has been long now acknowledged in medico-legal practice [2-4]. Walsh and associates [1] in an extended review article date the first use of Forensic Radiology in the murder case of Elizabeth Ann Hattley in England (1897). However, Brogdon and Lichtenstein [5] report an earlier case in Montreal (1895) concerning the attempted murder of T. Cunning by G. Holder. The first criminal case in the US involving expert witness testimony based on a radiograph was the murder trial of Haymen (1897) in Watertown, N.Y. [5]. These first cases opened the field of Forensic Radiology and the acceptance of radiographic evidence and expert witness testimony slowly began.
Cases of highly decomposed, mutilated, incinerated or skeletonized bodies are impossible to be identified by conventional means such as facial features, fingerprints, birthmarks or scars [4]. Positive identification can be accomplished with the comparison of ante-mortem and post-mortem radiographs. Dental records [6-7], former fractures, surgical work [8-9] calcification of tissues, stones or bladder-stones [4, 10-11] have been used for that purpose. Scholars report numerous cases of positive identification using different cranial features such as dental records [12], frontal sinuses [13-17], anatomical structures [18-19] and trabecular architecture [20].
Despite the fact that the most frequent application of forensic radiography serves positive identification, it has been widely used in biological profiling of the deceased, determination of cause and manner of death, medical negligence, non-accidental trauma and smuggling [4, 21-22]. Radiography has been proven very useful in mass disasters like airplane crashes or bomb explosions where there is no information of whether there are individuals involved [1, 23]. A post-mortem radiological examination allows the detection of metallic foreign bodies like bullets or bullets/bomb fragments on the body [4, 22-24]. This is of particular value in cases of highly decomposed bodies where the necropsy gives limited information on the circumstances of death. Such evidence is necessary for the reconstruction of the incident as well as for a court testimony.
Radiographic methods can be extremely useful in biological profiling of the deceased as well as in age estimation of the living. Brogdon [23] gives an example of what he calls “the absolute roentgenographic indicator of sex” in one of the victims of Air India crash (Flight 182, July, 2000). Many of the recovered victims had viscera displaced into the thoracic cavity resulting in the accidental discovery of an 18-22 week fetus in the chest radiograph of a young female. In addition several sex estimation methods have been developed by means of Radiography [25-26] and Computed Tomography [27-28].
The purpose of the current study is to explore the usefulness of digital radiographs of the radius in sex estimation. Since the integrity of the recovered bones in forensic settings cannot be assured, this study considers fragmentary models in order to simulate fragmentation due to post-mortem decomposition or mass disaster incidents.
Material and methodsTop
Study population
A total of 101 (53 males and 48 females) adult left radii was used in this study. The remains were selected from the exhumed skeletons of St. Konstantinos and Pateles Cemeteries, Heraklion, Crete (Cretan collection [29]). The assemblage consists of individuals who were born in the island of Crete, Greece between 1867 and 1956, and died between 1968 and 1998.
Radiographic equipment
A digital x-ray machine (Technix TCA 4R PLUS) was used for taking the radiographs of the radii. The digital acquisition system DIP2000 (Digital Image Processor) of the TCA 4R PLUS is an advanced and flexible device of acquisition, processing and image treatment. The system adjusts settings automatically according to the density of the projected object. The possibility to interface the system with video printers, VCRs and DICOM interfacing allows sending the acquired images for an easy reference and a quick storage. Thus data are quickly assessed from the digital X-ray machine and stored as bitmap images which are easy to manipulate.
Data acquisition
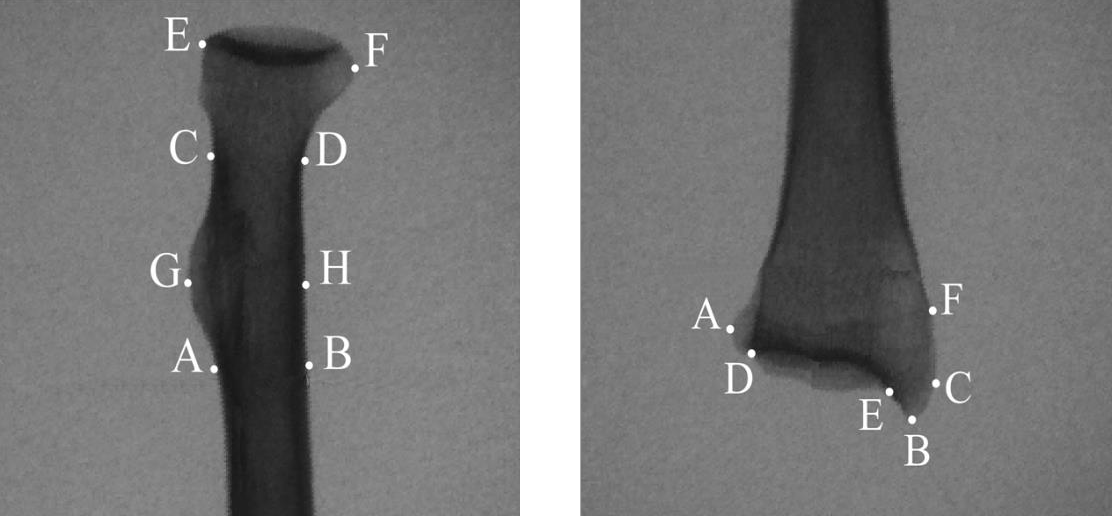
Standard orientation of the bones has been achieved by letting radius balance on the horizontal plane, with the anterior surface facing the X-ray camera. The radiographic table was placed at a distance of 54 cm from the head of the camera. A 5 cm scale was placed next to the object every time in order to ensure that measurements were reliable. Two landmarks were placed on the scale and this distance was known to be equivalent to 5 cm. Eight landmarks (A-G) are selected on the radiograph of the proximal radius and 28 generated distances (PR1-PR28), representing all possible combinations of these points were calculated. Six landmarks (A-G) are selected on the radiograph of the distal epiphysis and 15 generated distances (DR1-DR15) representing all possible combinations of these landmarks, were calculated. The selected landmarks for both proximal and distal radius are defined in Table 1 and illustrated in Figure 1.
| Proximal radius | |
| A | Point under the lateral projection of radial tuberosity |
| B | Point so that the distance AB is vertical to the axis of the radial shaft |
| C and D | Points on the radial neck so that the distance CD represents the minimum radial diameter on the radiograph |
| E and F | Points on the radial head so that the distance EF represents the maximum radial diameter on the radiograph |
| G | Point on the most lateral projection of the radial tuberosity |
| H | Point on the radial shaft so that the distance GH is vertical to the radial shaft |
| Distal radius | |
| A | Point on the most medial projection of the distal radial epiphysis |
| B | Point on the most distal projection of the styloid process |
| C | Point on the most lateral projection of the styloid process |
| D | Point on the most inferior and medial border of the articular facet and the medial border of the styloid process |
| E | Point of intersection between the posterior border of the articular facet and the medial border of the styloid process |
| F | Point of insertion of brachioradialis |
TpsUtil was used to create the databases from the radiographs. TpsDig2 [30] was used to digitize the selected landmarks and to incorporate the scaling factor. Morpheus et al. software [31] was used to generate the distances from the selected landmarks. Measurements were submitted to discriminant function analysis using SPSS 19.
Digitizing error
The quantification of intra-observer variation was conducted according to methods proposed by O'Higgins and Jones [32] and Martinón-Torres and colleagues [33]. Five specimens were randomly selected, each one was digitized five times and principal components analysis was carried out (using SPSS 19) for the whole sample and the repeats. The relative position of the repeats in respect to each other and to the other individuals was tested in an effort to evaluate the magnitude of error relative to the differences in shape between these five specimens and within the sample.
Statistical analysis
A one way ANOVA is used in order to calculate the means and the standard deviations for each measurement. All subset discriminant function analysis (DFA) was used to select the optimal combination of variables and to calculate specific formulae in order to classify cases in pre-existing groups according to the similarities between each case and the other cases belonging to the same group. A "leave-one-out" classification procedure is applied in order to demonstrate the accuracy rate of the original sample and the one created by cross-validation.
The normal curve models of the discriminatory variables for each group were used to provide estimates (posterior probabilities) of a particular score given membership in a particular group. Posterior probability is a statistic term referred to the probability of a case to be correctly classified according to the value of the discriminant score. More detailed description can be found in Kranioti and Michalodimitrakis [34] and Kranioti and Apostol [35]. For sex estimation three thresholds were considered (PP >/= 80%, PP >/= 90% and PP >/= 95%). In order to evaluate the accuracy of the given formulae posterior probabilities were calculated for all functions which resulted in more than 80% classification accuracy.
ResultsTop
Error estimation
After Principal component analysis was carried out principal component 1 and 2 were plotted in a diagram and the position of the repeats was checked against the rest of the sample and the position of the other repeats. Five repeats were tested for each radial epiphysis as described in section 2.4. It was demonstrated that in all cases the repeats were much closer to themselves than to other individuals or their repeats. This indicates small intra-observer error.
Univariate statistics
Proximal radius
Combining the eight selected landmarks on the proximal radius, 28 distances (PR1-PR28) were generated (Table 2). Descriptive statistics of the 28 dimensions and univariate differences between the sexes are shown in Table 3. Seven variables (PR1, PR5, PR11, PR15, PR19, PR23 and PR25) were found significantly different between the sexes at the level of p < 0.05 and three variables (PR16, PR20, PR27) were found significantly different at the level of p < 0.01. The remaining variables didn’t exhibit statistically significant differences between the two groups and therefore were excluded from further analysis.
| Proximal radius (28) | Distal radius (15) | ||||
| Variables | Distances | Variables | Distance | Variables | Distances |
| PR1 | AB | PR16 | CF | DR1 | AB |
| PR2 | AC | PR17 | CG | DR2 | AC |
| PR3 | AD | PR18 | CH | DR3 | AD |
| PR4 | AE | PR19 | DE | DR4 | AE |
| PR5 | AF | PR20 | DF | DR5 | AF |
| PR6 | AG | PR21 | DG | DR6 | BC |
| PR7 | AH | PR22 | DH | DR7 | BD |
| PR8 | BC | PR23 | EF | DR8 | BE |
| PR9 | BD | PR24 | EG | DR9 | BF |
| PR10 | BE | PR25 | EH | DR10 | CD |
| PR11 | BF | PR26 | FG | DR11 | CE |
| PR12 | BG | PR27 | FH | DR12 | CF |
| PR13 | BH | PR28 | GH | DR13 | DE |
| PR14 | CD | DR14 | DF | ||
| PR15 | CE | DR15 | EF | ||
| Proximal radius | Distal radius | ||||||||||
| V | Males (N = 53) |
Females (N = 50) |
V | Males (N = 52) |
Females (N = 49) |
||||||
| Mean | SD | Mean | SD | F- ratio | Mean | SD | Mean | SD | F- ratio | ||
| dPR1 | 13.21 | 1.3 | 12.08 | 3.9 | 4.05 | aDR1 | 31.13 | 2.54 | 28.50 | 1.99 | 45.72 |
| PR2 | 27.82 | 3.9 | 27.17 | 7.8 | 0.28 | aDR2 | 32.98 | 2.54 | 29.53 | 1.94 | 58.43 |
| PR3 | 29.58 | 3.9 | 28.30 | 7.9 | 1.10 | DR3 | 4.22 | 1.38 | 4.06 | 1.10 | 0.44 |
| PR4 | 42.36 | 4.3 | 40.31 | 9.5 | 2.05 | aDR4 | 25.14 | 2.35 | 23.15 | 2.00 | 20.91 |
| dPR5 | 43.68 | 3.9 | 40.42 | 10.0 | 4.64 | aDR5 | 32.19 | 2.68 | 28.18 | 1.75 | 78.60 |
| PR6 | 15.70 | 3.3 | 14.73 | 4.9 | 0.17 | aDR6 | 10.25 | 1.60 | 7.89 | 1.22 | 68.65 |
| PR7 | 19.42 | 2.5 | 18.23 | 5.5 | 2.05 | aDR7 | 27.08 | 1.95 | 24.20 | 1.66 | 63.45 |
| PR8 | 30.10 | 3.4 | 29.07 | 8.2 | 0.58 | aDR8 | 6.51 | 1.45 | 5.24 | 1.13 | 23.90 |
| PR9 | 25.60 | 3.8 | 24.82 | 6.6 | 0.54 | aDR9 | 17.66 | 2.11 | 15.37 | 2.20 | 28.59 |
| PR10 | 43.90 | 3.9 | 41.52 | 9.9 | 2.62 | aDR10 | 29.24 | 2.09 | 26.08 | 1.65 | 70.65 |
| dPR11 | 38.51 | 3.8 | 35.80 | 8.6 | 4.38 | aDR11 | 10.30 | 1.19 | 8.37 | 1.03 | 76.01 |
| PR12 | 21.86 | 2.6 | 21.14 | 6.8 | 0.51 | DR12 | 8.15 | 1.95 | 8.31 | 2.21 | 0.15 |
| PR13 | 13.40 | 3.0 | 13.14 | 4.0 | 0.14 | aDR13 | 21.12 | 1.82 | 19.38 | 1.75 | 23.96 |
| PR14 | 13.13 | 1.4 | 12.07 | 4.4 | 2.85 | aDR14 | 29.00 | 2.14 | 25.45 | 1.53 | 90.51 |
| dPR15 | 14.61 | 3.0 | 13.17 | 2.8 | 6.36 | aDR15 | 15.26 | 1.64 | 13.34 | 1.76 | 32.04 |
| bPR16 | 22.91 | 2.1 | 20.43 | 5.8 | 8.54 | aSignificantly different at the level of p < 0.001 bp < 0.005 cp < 0.01 dp < 0.05 |
|||||
| PR17 | 13.83 | 3.6 | 13.86 | 4.5 | 0.00 | ||||||
| PR18 | 18.84 | 2.7 | 17.71 | 5.5 | 1.81 | ||||||
| cPR19 | 21.51 | 1.9 | 19.39 | 5.5 | 6.97 | All the rest variables do not differ significantly between the sexes | |||||
| bPR20 | 14.17 | 2.4 | 12.27 | 3.3 | 11.30 | ||||||
| PR21 | 20.75 | 3.1 | 20.04 | 6.7 | 0.48 | ||||||
| PR22 | 12.22 | 3.3 | 11.71 | 3.4 | 0.61 | ||||||
| dPR23 | 21.56 | 1.8 | 19.35 | 6.1 | 6.30 | ||||||
| PR24 | 27.93 | 4.2 | 26.56 | 5.9 | 1.85 | ||||||
| dPR25 | 31.49 | 3.5 | 29.11 | 7.1 | 4.73 | ||||||
| PR26 | 34.01 | 3.7 | 31.59 | 8.9 | 3.31 | ||||||
| cPR27 | 25.53 | 3.5 | 23.15 | 5.4 | 7.08 | ||||||
| PR28 | 16.66 | 1.6 | 15.91 | 5.9 | 0.80 | ||||||
The 10 single dimensions of the proximal radius that were found to differ significantly between the sexes were submitted to DFA but only two performed well. More specifically PR 16 and PR23 are the only variables with classification accuracies that exceed 80%. F-ratios, cut-off values and classification accuracy for both original and cross-validated data are presented in Table 3. PR23 (85.4%) is the best discriminatory variable followed by PR16 (82.5%). Interestingly PR20 exhibited the higher F-ratio (Table 3). Yet it yielded only 73% accuracy which is below the accuracy threshold of 80% thus it is not included in Table 4.
| V1 | F- ratio | Cut-off value | Original | Cross-validated | ||||||||
| Males | Females | Total | Males | Females | Total | |||||||
| N = 53 | % | N = 50 | % | % | N = 53 | % | N = 50 | % | % | |||
| Proximal radius (Df = 1.102) | ||||||||||||
| PR16 | 8.54 | 21.67 | 40 | 75.5 | 45 | 90.0 | 82.5 | 40 | 75.5 | 45 | 90.0 | 82.5 |
| PR23 | 6.30 | 20.17 | 41 | 77.4 | 47 | 94.0 | 85.4 | 41 | 77.4 | 47 | 94.0 | 85.4 |
| Distal radius (Df = 1.100) | ||||||||||||
| F- ratio | Cut-off value | N = 52 | % | N = 49 | % | % | N = 52 | % | N = 49 | % | % | |
| DR5 | 78.6 | 30.18 | 39 | 75.0 | 42 | 85.7 | 80.2 | 39 | 75 | 42 | 85.7 | 80.2 |
| DR11 | 76.01 | 9.34 | 41 | 78.8 | 40 | 81.6 | 80.2 | 41 | 78.8 | 39 | 79.6 | 79.2 |
| DR14 | 90.51 | 27.22 | 39 | 75.0 | 45 | 91.8 | 83.2 | 39 | 75 | 45 | 91.8 | 83.2 |
Note: 1Only variables with classification accuracy > 80% are included in the table.
Distal radius
Combining the five selected landmarks, on the distal radius, 15 distances (DR1- DR15) were generated (Table 2). Descriptive statistics of the 15 dimensions and univariate differences between the sexes are shown in Table 3. All variables were found to differ significantly between the sexes at the level of p < 0.0001, except DR3 and DR12 which were excluded from further analysis. The remaining 12 variables were submitted to DFA but only three of them resulted in classification accuracies higher than 80%.
More specifically DR14 was found to be the most effective single dimension yielding 83.2% accuracy, followed by DR5 and DR11 which both performed the same (80.2%) for the original data. F-ratios, cut-off values and classification accuracy for both original and cross-validated data are presented in Table 4.
Multivariate statistics
Proximal radius
Various formulae were produced using direct and stepwise discriminate function analysis of various combinations of the variables for the proximal radius. Only the 10 single dimensions that were found to differ significantly between the sexes (Table 3) were employed for this analysis. When all 10 variables were used with a direct procedure, classification accuracy did not exceed 80%. The same happened when stepwise procedure was applied. The variables were combined with many different ways seeking for the highest possible classification accuracy for both original and cross-validated data. The best combination using only two variables did not exceed the accuracies of single variables neither the cut-off of 80% that was set as a threshold in this study; therefore this formula is not presented herein.
Distal radius
Various formulae were produced using direct and stepwise DFA of various different combinations of the 12 variables for the distal radius. When direct DFA was applied to all 12 measurements, 3 of them (DR11, DR13 and DR14) were rejected automatically due to high co-variation with some of the remaining 9 measurements. The combination of the 9 measurements (DRF1) gave a classification accuracy of 88.1% for the original data and 84.2% for the cross-validated sample. When stepwise procedure was applied (DRF2), only two (DR6 and DR14) out of nine variables were selected. Many different combinations gave similar classification results for the original data but worse for the cross-validated ones. Some of the best formulae for separating the sexes along with classification results for both original and cross-validated data are presented in Table 5. Only formulae with accuracies that overcome 80% for cross-validated data are included. Sectioning point is set to zero in all cases. DRF1 is the result of a direct DFA using the three more effective single variables (DR6, DR11 and DR14). Classification accuracy reached 86.1% for original whereas “leave-one-out” classification was only slightly lower.
| V | F-ratios | Raw coefficients | Male | Female | Total | |||
| N = 52 | % | N = 49 | % | % | ||||
| DRF1 | ||||||||
| DR1 | 45.72 | 2.704 | 44 | 84.6 | 45 | 91.8 | 88.1 | Original |
| DR2 | 58.43 | 0.019 | 41 | 79.8 | 44 | 89.8 | 84.2 | Cross- validated |
| DR4 | 20.91 | -3.472 | ||||||
| DR5 | 78.60 | 0.689 | ||||||
| DR6 | 68.65 | 0.432 | ||||||
| DR7 | 63.45 | 0.670 | ||||||
| DR8 | 23.90 | -3.266 | ||||||
| DR9 | 28.59 | 0.666 | ||||||
| DR10 | 70.65 | -0.236 | ||||||
| DR15 | 32.04 | -0.759 | ||||||
| Constant | -13.186 | |||||||
| DRF2 | ||||||||
| DR14 | 90.50604 | 0.3693301 | 42 | 80.8 | 43 | 87.8 | 84.2 | Original |
| DR6 | 57.546694 | 0.3557052 | 42 | 80.8 | 43 | 87.8 | 84.2 | Cross- validated |
| Constant | -13.279876 | |||||||
| DRF3 | ||||||||
| DR6 | 68.65 | 0.2419291 | 42 | 80.8 | 45 | 91.8 | 86.2 | Original |
| DR14 | 90.51 | 0.3293304 | 41 | 78.8 | 44 | 89.8 | 84.2 | Cross- validated |
| DR11 | 76.01 | 0.2286180 | ||||||
| Constant | -13.294180 | |||||||
Posterior probabilities
Univariate statistics
Proximal radius
Posterior probabilities for the measurements taken on the radiographs of the proximal radius resulted in grouping all the specimens under a 0.8 threshold suggesting that there is a considerable degree of overlap between the two groups.
Distal radius
Posterior probabilities for the measurements taken on the radiographs of the distal radius classified up to 29% of the specimens at a 0.95 threshold. More specifically DR14 classified 43% of the sample at a 0.9 and 29% of the sample at a 0.95 threshold with 83% accuracy. The cut-off values for this formula at a 0.95 threshold are 30.26 mm for males and 16.3 mm for females (Table 6).
| PP(%) | Males | Females | Total % | Males | Females | Total % | ||||
| COV | % | COV | % | DS | % | DS | % | |||
| DR5 | DRF1 | |||||||||
| >95 | >34.00 | 28.9 | <25.93 | 14.3 | 21.8 | >1.2501 | 51.9 | <-1.2378 | 49.0 | 50.5 |
| >90 | >33.14 | 42.3 | <27.27 | 28.6 | 35.6 | >1.0732 | 59.6 | <-0.9202 | 69.4 | 64.4 |
| >80 | >32.46 | 55.8 | <28.37 | 57.1 | 56.4 | >0.5772 | 67.3 | <-0.6349 | 85.7 | 76.2 |
| >50 | >30.18 | 75.0 | <30.18 | 85.7 | 80.2 | >0 | 84.6 | <0 | 91.8 | 88.1 |
| DR11 | DRF2 | |||||||||
| >95 | >11.35 | 21.2 | <7.4 | 18.4 | 19.8 | >1.4503 | 48.1 | <-1.426 | 28.6 | 38.6 |
| >90 | >10.76 | 32.7 | <7.8 | 36.7 | 34.7 | >1.1898 | 51.9 | <1.0419 | 63.3 | 57.4 |
| >80 | >10.26 | 55.8 | <8.44 | 55.1 | 55.5 | >0.6541 | 65.4 | <-0.6524 | 77.6 | 71.3 |
| >50 | >9.34 | 78.9 | <9.34 | 81.6 | 80.2 | >0 | 80.8 | <0 | 87.8 | 84.2 |
| DR14 | DRF3 | |||||||||
| >95 | >30.26 | 42.3 | <24.24 | 16.3 | 29.7 | >1.4316 | 46.2 | <-1.3826 | 34.7 | 40.6 |
| >90 | >29.52 | 51.9 | <24.97 | 32.7 | 42.6 | >1.0569 | 59.6 | <-1.0207 | 61.2 | 60.4 |
| >80 | >28.84 | 61.5 | <25.82 | 55.1 | 58.4 | >0.6925 | 69.2 | <-0.7147 | 77.6 | 73.3 |
| >50 | >27.26 | 75.0 | <27.26 | 91.8 | 83.2 | >0 | 80.8 | <0 | 91.8 | 86.1 |
Abbreviations: Abbreviations: COV = cut-off value (for univariate functions); DS = discriminant score (for multivariate functions).
Multivariate statistics
Proximal radius
Multivariate discriminant functions using different number of variables of the proximal radius did not exceed the cut-off of 80% accuracy that it was set in this study. Therefore, posterior probabilities for the multivariate functions of the proximal radius are not presented here.
Distal radius
The best multivariate discriminant function for the distal radius (DRF1) classified over 76% of the sample at a 0.8, over 64% at a 0.9 and over 50% at a 0.95 threshold exhibiting 88% correct group membership. For this function, discriminant scores over 1.2501 classify males and under -1.2378 classify females at a 0.95 threshold. DRF3 classified over 60% of the sample with 90% probability and over 40% with 95% probability of correct group assignment with 86.1% accuracy. For this function and any individual with a discriminant score (that is the result of each formula when measurements are applied) DS > 1.4316 has 95% probability to be a male while if DS < -1.3826 it has 95% probability to be a female. Posterior probabilities for all multiple discriminant functions of the distal radius are shown in Table 6.
Recommendations for forensic applications on the Greek sample
Proximal radius
If the proximal radius is the only available fragment it is recommended to use PR23 which is the univariate formulae with the best cross-validated accuracy (Table 4). If PR23 > 20.17 mm the radial fragment belongs to a male individual while in the opposite case it belongs to a female.
The fact that posterior probabilities of correct classification were calculated to be < 80% (see 3.4.1.1) for the whole sample implies that this variable may not be such a reliable single indicator for sex estimation and should be used carefully and in conjunction with other methods in order to give a more accurate sex estimate for a given forensic case of unknown sex.
Distal radius If the distal radius in the only fragment available for analysis the best formula for this sample is DRF1 which although presents the same cross-validated accuracy with DRF2 and DRF3 (Table 5), it classifies over 50% of the sample with over 95% posterior probability. More specifically the numerical expression of the formula is as follows: DRF1 = 2.704*DR1 + 0.019*DR2 - 3.472*DR4 + 0.689*DR5 + 0.432*DR6 + 0.67*DR7 - 3.266*DR8 + 0.666*DR9 - 0.236*DR10 - 0.759*DR15 - 13.186 (Table 5). If DRF1 > 1.2501; the unknown fragment belongs to a male with 95% confidence. If DRF1 < -1.2378 the unknown fragment belongs to a female with 95% confidence. In this case it is safe to say that the method can provide reliable results. Nevertheless, it should be used in conjunction with other methods if available.
DiscussionTop
Forensic Radiology refers to the application of the science of diagnostic imaging to assist forensic investigations that require diagnosis or confirmation of cause of death, positive identification, detection of foreign bodies, and incidents of abuse in children, among others. Sex can be identified through medical imaging techniques by the shape and the size of the pelvis, the cranial features and the size of the long bones [23]. It has long been established that there is a distinct difference in sex pattern in costal cartilage calcification [36-37]. Calcification of tracheobronchial cartilage occurs rarely but it exhibits a female predominance while thyroid cartilage ossification occurs more often in males [23]. For human remains, where some soft tissue is retained, a radiograph of the chest plate can provide a useful method of sexing [38-41]. Other investigators used chest plate radiographs from which measured dimensions of the sternum and ribs [42]. Riepert and associates [25] studied sexual dimorphism in radiographs of the calcaneus achieving 80% correct group membership. Patil and Mody [43] reported sex estimation from lateral cephalograms with 99% accuracy. Abdel Moneim and collaborators [44] developed a sex estimation method based on patella and foot measurements on radiographs with 100% correct classification of the original sample and 88% correct classification of an independent test sample.
Osteometric studies of the radius are conducted for several populations affirming the existence of sexual dimorphism [45-48]. Berrizbeitia [45] analysed a sample 1108 radii (left and right) corresponding to Black and White North Americans from the Terry Collection, in respect to the radial head resulting in 92-96% correct group membership. Mall and co-workers [46], in a study of the upper extremity of a contemporary German population, included three radial dimensions (maximum length, maximum head diameter and distal width). Maximum head diameter was the second best discriminatory variable (88.6%) after radial length, while multivariate discriminant function analysis for the radius gave 94.9% accuracy. In a study by Safont and collaborators [47] using the circumferences of long bones, radial tuberosity circumference was found to be the second most effective single dimension, with a classification accuracy of 92.8%. Barrier and L Ábbe [48] took 9 measurements in a sample of 400 South African radii. Classification accuracy reached 88% when all measurements were applied, while minimum midshaft diameter was the best discriminatory variable (86%). Last, an osteometric study on the radius in the same Cretan population resulted in 86.1% accuracy for the radial head diameter and only 80% accuracy for the distal radius breadth. The combination of both variables did not seem to improve classification accuracy significantly (86.7%) [49].
There are hardly any radiographic studies, however, dealing with sex estimation of the radius. One of the first attempts was conducted by Allen, Bruce and MacLaughlin [50] in Leiden (1987) using a portable X-Ray machine. They measured 3 dimensions on the radius and used the midpoint between the male and female mean as the sectioning point. They found maximum transverse distal width to be the best sex indicator with 85% accuracy. Although nowadays their approach is outdated by multivariate statistical methods, their work proved the value of radiographs of the radius in sex estimation by highlighting the differences between males and females. Most recent studies from radiographs and CT scans of the radius focus in developing age [51] and stature estimation methods [52-54]. A study by Baumbach and colleagues [55] investigated the correlation of maximum length and distal width using radiographs of the radius.
The present study aims at developing a sex estimation method based on radiographs of the proximal and distal epiphysis of the radius. For that purpose 43 new metric variables were tested with one way ANOVA to explore statistically significant differences between the sexes and then were submitted to univariate and multivariate discriminant function analysis. The best formula for the proximal epiphysis was developed with a single variable (PR23, 85.4%) while different combination of variables gave poor results for cross-validated data. PR23 is the maximum distance between the most lateral points on the radial head (including the radial tuberosity) as seen on 2D projections in X-rays. The remaining variables are proportional to DR23 which means that adding them in the statistical model would not improve classification accuracy as they do not contribute anything additional to the expression of sexual dimorphism. For the distal epiphysis the best variable was DR14 (83.2%) while three multivariate formulae gave over 84% accuracy for cross-validated data (Table 5). DR14 classified about 30% of the original sample with > 95% probability of correct classification. DRF1 classified over 50% of the sample with > 95% probability of correct sex assessment which makes it the best choice among univariate and multivariate functions for both epiphyses.
Digital Radiography and Computed Tomography have marked a new era in the development of standards for biological profiling. The increasing use of medical imaging methods can be attributed to several reasons as the lack of modern reference collections. In Muslim countries religion prohibits the exhumation of the bodies once they are buried which makes the creation of modern skeletal collections problematic. Other countries as the UK face the problems of strict legislation when it comes to using modern human remains for research (Human Tissue Act [56]). Such limitations are easily dealt by using archives of hospitals with anonymized patient data. The results of this study are comparable to the abovementioned osteometric studies, when fragmentary patterns are considered (full length not available) and only slightly lower (1-2%) compared to the osteometric study on the same population [49]. The highest accuracy for single variables is identical to the one reported by Allen, Bruce and MacLaughlin [50] in their radiometric study. These results confirm that the use of portable X-ray machines in the examination of skeletal remains can be beneficial for the forensic practitioner as suggested by radiographic studies on other bones [25, 57, 59]. The sex estimation method based on the X-rays of the radius presented here is based on a documented sample of a modern Greek population thus it should not be considered applicable to other populations without further testing.
ConclusionTop
The important point to be made is that radiometric techniques are applicable in forensic cases for identification purposes and their employment can be advantageous when a rapid examination is required and maceration is not an option. The present study does not aim to propose a method that would replace the osteometric techniques but to offer an alternative method applicable in certain circumstances in which osteometry cannot be applied; acknowledging that the method of choice in forensic anthropology is dictated by the individual case specifics.
Conflicts of interest
The author declares no conflict of interests.
ReferencesTop
[1]Walsh M, Reeves P, Scott S. When disaster strikes; the role of the forensic radiographer. Radiography. 2004; 10(1):33–43.Article
[2]Evans KT, Knight B. Forensic Radiology. Oxford, UK: Blackwell, 1981.
[3]Krogman WM, İşcan MY. The human skeleton in forensic medicine, 2nd edition ed. Illinois, USA: Springfield. 1986.
[4]Brogdon BG. Forensic aspects of Radiology. In: Spitz WU, Spitz DJ, Clark R, Fisher RS, editors. Spitz and Fisher's medicolegal investigation of death: Guidelines for the application of pathology to crime investigation 4th edition ed. Illinois, USA: Springfield. 2006:1092–1135.Article
[5]Brogdon BG, Lichtenstein JE. Forensic Radiology in historical perspective. In: Brogdon BG, editor. Forensic Radiology. Boca Raton, Florida CRC Press, LLC. 1998:13–34.Article
[6]Pretty IA, Sweet D. A look at forensic dentistry-Part 1: The role of teeth in the determination of human identity. Br Dent J. 2001; 190(7):359–366.Article Pubmed
[7]Pretty IA. Forensic dentistry: 1. Identification of human remains. Dent Update. 2007; 34(10):621–622, 624–626, 629–630.Article Pubmed
[8]Simpson EK, James RA, Eitzen DA, Byard RW. Role of orthopedic implants and bone morphology in the identification of human remains. J Forensic Sci. 2007; 52(2):442–448.Article Pubmed
[9]Šlaus M, Strinović D, Pećina-Šlaus N, Brkić H, Baličević D, et al. Identification and analysis of human remains recovered from wells from the 1991 war in Croatia. Forensic Sci Int. 2007; 171(1):37–43.Article Pubmed
[10]Murphy WA, Spruill FG, Ganter GE. Radiological identification of unknown human remains. J Forensic Sci. 1980; 25(4):727–735.Article Pubmed
[11]Kahana T, Hiss J. Suprapelvic and pelvic phleboliths – a reliable radiographic marker for positive identification. J Clin Forensic Med. 2002; 9(3):115–118.Article Pubmed
[12]Nicopoulou-Karayianni K, Mitsea AG, Horner K. Dental diagnostic radiology in the forensic sciences: Two case presentations. J Forensic Odontostomatol. 2007; 25(1):12–16.Article Pubmed
[13]Marlin DC, Clark MA, Standish SM. Identification of human remains by comparison of frontal sinus radiographs: A series of four cases. J Forensic Sci. 1991; 36(6):1765–1772.Article Pubmed
[14]Quatrehomme G, Fronty P, Sapanet M, Grévin G, Bailet P, et al. Identification by frontal sinus pattern in forensic anthropology. Forensic Sci Int. 1996; 83(2):147–153.Article Pubmed
[15]Kirk NJ, Wood RE, Goldstein M. Skeletal identification using the frontal sinus region: A retrospective study of 39 cases. J Forensic Sci. 2002; 47(2):318–323.Pubmed
[16]Wood RE. Forensic aspects of maxillofacial radiology. Forensic Sci Int. 2006; 159(Suppl 1):S47–55.Article Pubmed
[17]Tang JP, Hu DY, Jiang FH, Yu XJ. Assessing forensic applications of the frontal sinus in a Chinese Han population. Forensic Sci Int. 2009; 183(1–3):104.e1–3.Article Pubmed
[18]Messmer JM, Fierro MF. Personal identification by radiographic comparison of vascular groove patterns of the calvarium. Am J Forensic Med Pathol. 1986; 7(2):159–162.Article Pubmed
[19]Rhine S, Sperry K. Radiographic identification by mastoid sinus and arterial pattern. J Forensic Sci. 1991; 36(1):272–279.Pubmed
[20]Van der Stelt P, Webber R, Ruttimann U. Forensic identification of trabecular patterns from dental radiographs. J Dent Res. 1986; 65:176.
[21]Kahana T, Hiss J. Identification of human remains: Forensic radiology. J Clin Forensic Med. 1997; 4(1):7–15.Article Pubmed
[22]Kahana T, Hiss J. Forensic radiology. Br J Radiol. 1999; 72(854):129–133.Article Pubmed
[23]Brogdon G. Forensic Radiology. Boca Raton, Florida CRC Press, LLC. 1998.
[24]Stein KM, Grünberg K. Forensische Radiologie. Radiologe. 2009; 49(1):73–86.Article Pubmed
[25]Riepert T, Drechsler T, Schild H, Nafe B, Mattern R. Estimation of sex on the basis of radiographs of the calcaneus. Forensic Sci Int. 1996; 77(3):133–140.Article Pubmed
[26]DeSilva R, Flavel A, Franklin D. Estimation of sex from the metric assessment of digital hand radiographs in a Western Australian population. Forensic Sci Int. 2014; 244:314.e1–7.Article Pubmed
[27]Uthman AT, Al-Rawi NH, Al-Naaimi AS, Al-Timimi JF. Evaluation of maxillary sinus dimensions in gender determination using helical CT scanning. J Forensic Sci. 2011; 56(2):403–408.Article Pubmed
[28]Djorojevic M, Roldán C, García-Parra P, Alemán I, Botella M. Morphometric sex estimation from 3D computed tomography os coxae model and its validation in skeletal remains. Int J Legal Med. 2014; 128(5):879–888.Article Pubmed
[29]Kranioti EF, İşcan MY, Michalodimitrakis M. Craniometric analysis of the modern Cretans population. Forensic Sci Int. 2008; 180(2-3):110.e1–5.Article Pubmed
[30]Rohlf FJ. Morphometric software distributed via the Stony Brook Morphometrics. Department of Ecology and Evolution, State University, Stony Brook, New York. 1997.Website
[31]Slice DE, Morpheus. Software for morphometric research. Revision 01-01-00, New York, Department of Ecology and Evolution, State University, Stony Brook.
[32]O'Higgins P, Jones N. Facial growth in Cercocebus torquatus: An application of 3D geometric morphometric techniques to the study of morphological variation. J Anat. 1998; 193(Pt 2):251–272.Article Pubmed
[33]Martinón-Torres M, Bastir M, Bermúdez de Castro JM, Gómez A, Sarmiento S, et al. Geometric morphometric analysis of hominin lower second premolars: Evolutionary implications. J Hum Evol. 2006; 50:523–533.
[34]Kranioti EF, Michalodimitrakis M. Sexual dimorphism of the humerus in contemporary Cretans—a population-specific study and a review of the literature. J Forensic Sci. 2009; 54(5):996–1000.Article Pubmed
[35]Kranioti EF, Apostol M, Sexual dimorphism of the tibia in contemporary Greeks, Italians and Spanish: forensic implications. Int J Legal Med. 2015; 129(2):357–63.Article Pubmed
[36]Sanders CF. Sexing by costal cartilage calcification. Br J Radiol. 1966; 39(459):233.Article Pubmed
[37]Navani S, Shah JR, Levy PS. Determination of sex by costal cartilage calcification. Am J Roentgenol Radium Ther Nucl Med. 1970; 108(4):771–774.Pubmed
[38]McCormick WF, Stewart JH. Ossification patterns of costal cartilages as an indicator of sex. Arch Pathol Lab Med. 1983; 107(4):206–210.Pubmed
[39]McCormick WF, Stewart JH, Langford LA. Sex determination from chest plate roentgenograms. Am J Phys Anthropol. 1985; 68(2):173–179.Article Pubmed
[40]Pao NG, Pai LM. Costal cartilage calcification pattern--a clue for establishing sex identity. Forensic Sci Int. 1988; 38(3-4):193–202.Article Pubmed
[41]Rejtarová O, Slízová D, Smoranc P, Rejtar P, Bukac J. Costal cartilages-a clue for determination of sex. Biomed Pap Med Fac Univ Palacky Olomouc Czech Repub. 2004; 148(2):241–243.Article Pubmed
[42]Torwald CR, Hoppa RD. A test of sex determination from measurements of chest radiographs. J Forensic Sci. 2005; 50(4):785–790.Article Pubmed
[43]Patil KR, Mody RN. Determination of sex by discriminant function analysis and stature by regression analysis: a lateral cephalometric study. Forensic Sci Int. 2005; 147:175–180.Article Pubmed
[44]Abdel Moneim WM, AM Abdel Hady RH, Abdel Maaboud RM, Fathy HM, Hamed AM. Identification of sex depending on radiological examination of foot and patella. Am J Forensic Med Pathol. 2008; 29:136–140.Article Pubmed
[45]Berrizbeitia EL. Sex determination with the head of the radius. J Forensic Sci. 1989; 34(5):1206–1213.Article Pubmed
[46]Mall G, Hubig M, Büttner A, Kuznik J, Penning R, et al. Sex determination and estimation of stature from the long bones of the arm. Forensic Sci Int. 2001; 117(1-2):23–30.Article Pubmed
[47]Safont S, Malgosa A, Subirà ME. Sex assessment on the basis of long bone circumference. Am J Phys Anthropol. 2000; 113(3):317–328.Article Pubmed
[48]Barrier ILO, L’Abbé EN. Sex determination from the radius and ulna in a modern South African sample. Forensic Sci Int. 2008; 179(1):85–87.Article Pubmed
[49]Kranioti EF. Sex identification based on digital radiographs of the skeleton. Unpublished PhD thesis. Medical School, University of Crete, Heraklion, Crete. 2009.Article
[50]JC Allen, MF Bruce, SM MacLaughlin. Sex determination from the radius in humans. Human Evolution. 1987; 2(4):373–378.Article
[51]Baumann U, Schulz R, Reisinger W, Heinecke A, Schmeling A, et al. Reference study on the time frame for ossification of the distal radius and ulnar epiphyses on the hand radiograph. Forensic Sci Int. 2009; 191(1-3):15–18.Article Pubmed
[52]Petrovecki V, Mayer D, Slaus M, Strinović D, Skavić J. Prediction of stature based on radiographic measurements of cadaver long bones: a study of the Croatian population. J Forensic Sci. 2007; 52(3):547–552.Article Pubmed
[53]Muñoz JI, Liñares-Iglesias M, Suárez-Peñaranda JM, Mayo M, Miguéns X et al. Stature estimation from radiographically determined long bone length in a Spanish population sample. J Forensic Sci. 2001; 46(2):363–366.Article Pubmed
[54]Akhlaghi M, Sheikhazadi A, Ebrahimnia A, Hedayati M, Nazparvar B, et al. The value of radius bone in prediction of sex and height in the Iranian population. J Forensic Leg Med. 2012; 19(4):219–222.Article Pubmed
[55]Baumbach SF, Krusche-Mandl I, Huf W, Mall G, Fialka C. Linear intra-bone geometry dependencies of the radius: Radius length determination by maximum distal width. Eur J Radiol. 2012; 81(5):947–950.Article Pubmed
[56]UK Public General Acts.Website
[57]Kranioti EF, Vorniotakis N, Galiatsou C, İşcan MY, Michalodimitrakis M. Sex identification and software development using femoral radiographs. Forensic Sci Int. 2009; 189(1-3):113.Article Pubmed
[58]Kranioti EF, Bastir M, Sánchez-Meseguer A, Rosas A. A geometric-morphometric study of the cretan humerus for sex identification. Forensic Sci Int. 2009; 189(1-3):111. Article Pubmed
[59]Kranioti EF, Nathena D, Michalodimitrakis M. Sex estimation of the cretan humerus: A digital radiometric study. Int J Legal Med. 2011; 125(5):659–667.Article Pubmed
 Copyright
© 2012-2025 NobleResearch Group. All Rights Reserved
Copyright
© 2012-2025 NobleResearch Group. All Rights Reserved