


- Download PDF
- |
- Download Citation
- |
- Email a Colleague
- |
- Share:
-
- Tweet
-
Journal of Radiology and Imaging
Volume 4, Issue 4, July 2020, Pages 25–29
Original researchOpen Access
Lack of clinically meaningful anatomical variations in bone marrow apparent diffusion coefficient in diffuse pattern myeloma allows untargeted sampling to confirm disease burden
-
Archie Keeling1, Simon O’Connor2, Kevin Boyd2,3, Martin Kaiser2,3, Matthew Blackledge3, Dow-Mu Koh2,3,* and Christina Messiou2,3,*

*Corresponding author: Christina Messiou, MD, Department of Radiology, The Royal Marsden Hospital, Sutton, United Kingdom. Tel.: +442086426011; E-mail: Christina.Messiou@rmh.nhs.uk
Received 21 April 2020 Revised 14 June 2020 Accepted 23 June 2020 Published 1 July 2020
DOI: http://dx.doi.org/10.14312/2399-8172.2020-4
Copyright: © 2020 Keeling A, et al. Published by NobleResearch Publishers. This is an open-access article distributed under the terms of the Creative Commons Attribution License, which permits unrestricted use, distribution and reproduction in any medium, provided the original author and source are credited.
AbstractTop
Posterior iliac crest trephine may result in sampling error and incorrect measures of disease burden in patients with multiple myeloma. This may influence the decision to treat. To compare the regional apparent diffusion coefficient of bone marrow in patients with multiple myeloma without focal bone lesions and their correlation with indices of disease burden, whole-body diffusion weighted imaging of 48 patients with diffuse myeloma were retrospectively reviewed. Three regions of interest were drawn over four anatomical sites on apparent diffusion coefficient maps and average values recorded. Apparent diffusion coefficient values were compared using the Wilcoxon signed-rank test with p-value < 0.0125 (Bonferroni correction) taken as statistical significance. Average apparent diffusion coefficient values were correlated with age-adjusted marrow cellularity and plasma cell proportion at histopathology, and international staging system scores. There was no significant difference in the apparent diffusion coefficient of bone marrow in the left ilium (754 × 10-6 mm2/s), right ilium (733 × 10-6 mm2/s) and T6 (701 × 10-6 mm2/s) but it was significantly lower in L3 (636 × 10-6 mm2/s) (p-value < 0.0125). However, the variance of apparent diffusion coefficient across all sites were within limits of measurement repeatability (15%). No correlation was found between per-patient average apparent diffusion coefficient with age-adjusted marrow cellularity (p=0.7), proportion of plasma cells (p=0.2) or ISS scores (p=0.5). There was no clinically meaningful difference in apparent diffusion coefficient values across anatomical sites in diffuse myeloma. Untargeted bone marrow biopsy is likely to be representative in this patient group.
Keywords: multiple myeloma; magnetic resonance imaging; apparent diffusion coefficient; bone marrow; biopsy
IntroductionTop
Multiple myeloma (MM) is a haematological malignancy of plasma cells primarily affecting the bone marrow. Over the past decade, whole body MRI (WB-MRI) has emerged as the most sensitive technique for detecting focal active myeloma lesions within bone marrow. As a consequence, the International Myeloma Working Group (IMWG) recommend whole body magnetic resonance imaging (WB-MRI) for all patients with a suspected diagnosis of apparently solitary plasmacytoma or suspected smouldering or symptomatic myeloma where CT is negative/equivocal as detection of focal lesions influences management [1]. If disease can be detected early, and patients stratified and treated according to clinical risk, survival advantages are conferred [2-7]. Furthermore, most patients with apparently solitary plasmacytoma on skeletal surveys are upstaged by MRI which profoundly influences treatment strategies [8, 9]. The number and size of focal lesions on MRI have also been shown to predict outcome [10, 2]. In the UK, the National Institute of Care and Health Excellence (NICE) recommends WB-MRI as first line imaging for assessment of all patients with a suspected diagnosis of myeloma or relapse/progression [11]. The inclusion of diffusion weighted imaging (DWI) into WB-MRI protocols increases sensitivity further [12-14] but also enables qualitative and quantitative assessments of response using apparent diffusion coefficient (ADC) measurements [15-18].
The IMWG now recognise the presence of more than one unequivocal focal lesion ≥5mm on MRI as a biomarker of malignancy which contributes to the decision to treat [8]. However, despite evidence that diffuse infiltration may confer a worse prognosis [19], the presence of diffuse infiltration in the absence of focal lesions is not included as part of the diagnostic criteria. This is likely due to the absence of definitive criteria for the diagnosis of diffuse infiltration. To date diffuse infiltration is suspected when T1 marrow signal falls below that of adjacent discs and more recently ADC thresholds have been proposed. However, there is potential for false positive MRI appearances due to marrow hypercellularity from other causes i.e., age-related, reactive or secondary to treatment such as granulocyte colony stimulating factor. Therefore, confirmation of disease with bone marrow sampling remains mandatory.
The posterior iliac crest is routinely used as the site for bone marrow trephine but if disease is heterogenous sampling errors are possible. A crucial element of the diagnostic criteria for multiple myeloma is >10% clonal bone marrow plasma cells along with a myeloma defining event or >60% clonal marrow plasma cell percentage as a biomarker of malignancy. This study aims to determine if there are significant differences in marrow ADC at different anatomical sites which would raise suspicion for sampling errors in patients with diffuse marrow infiltration. Correlations of ADC with standard measures of disease burden are also investigated.
Materials and methodsTop
Institutional review board approval was obtained. A retrospective search was conducted through our prospectively maintained WB-MRI database between August 2015 and August 2018. Consecutive scans on 68 patients with suspected new or relapsed myeloma (Table 1), [20, 8] and no focal lesions were identified by the lead myeloma radiologist at this institution with clinical clarification from a consultant haematologist.
| Disease status as defined by set criteria | |
| Disease status | Disease criteria |
| Active myeloma | Clonal bone marrow plasma cells >10% and any more or more of the following CRAB features and myeloma-defining events: |
| Evidence of end organ damage that can be attributed to the underlying plasma cell proliferative disorder, specifically: hypercalcaemia, renal insufficiency, anaemia, bone lesions (patients with bone lesions excluded in this series). | |
| Any one or more of the following biomarkers of malignancy: · 60% of greater clonal plasma cells on bone marrow examination. · Serum involved / uninvolved free light chain ratio of 100 or greater, provided the absolute level of the involved light chain is at least 100mg/L. · More than one focal lesion on MRI that is at least 5mm or greater in size (excluded from this series). |
|
| Relapsed myeloma | Definite increase in the size of existing plasmacytomas or bone lesions (not applicable to this series. |
| Hypercalcemia (> 11mg/dL) | |
| Decrease in haemoglobin of ≥ 2 g/dL not related to therapy or other non-myeloma-related conditions. | |
| Rise in serum creatinine by 2mg/dL or more from the start of the therapy and attributable to myeloma. | |
| Hyperviscosity related to serum protein. | |
| Increase of 25% from the lower confirmed response value in one or more of the following criteria: · Serum M-protein (the increase must be at least 0.5 g/dL). · Urine M-protein (the increase must be at least 200 mg/24 hours). If no serum or urine M-protein can be measured, the difference between the involved (abnormal, or monoclonal) and uninvolved (normal or polyclonal) free light chain levels (the increase must be >10 mg/dL). |
|
Patients in whom the time interval between WB-MRI and marrow trephine was 6 weeks or with evidence of changing serum biochemistry between the 2 events were excluded.
MRI
Whole body MRI examinations were obtained by the serial acquisition of contiguous body regions using a Siemens Avanto 1.5 T system in line with MY-RADS consensus document on whole body MRI for patients with MM [21]. All patients were scanned in a supine position with arms by their side. Images were acquired using a 1.5 T Siemens Avanto. Axial T1-weighted spin-echo (5 mm section thickness, no gap, 430 mm field of view, anteroposterior phase direction, 386 ms repetition time (TR)/ 4.8 ms echo time (TE), 70o flip angle, 256 × 154 matrix) and coronal VIBE Dixon 2D gradient-echo breath-hold sequences (52 sections per slab, 470 mm FOV, 7 ms TR/ 2.38, 4.76 ms TE 3o flip angle, 192 × 192 matrix) were acquired, followed by axial diffusion weighted sequences (single-shot double spin-echo echo-planar technique with short tau inversion recovery fat suppression in free breathing). b-Values of 50 and 900 s/mm2 were applied in three orthogonal direction and combined to provide isotropic trace images. Diffusion weighted sequences were acquired in blocks of 50 sections (5 mm section thickness, no gap, 430 mm FOV, anteroposterior phase direction, parallel imaging (GRAPPA), factor 2, 14,800 ms TR, 66 ms TE, 180 ms inversion time, 2.9 × 2.9 × 5 mm voxel size, four signal averages acquired, 150 × 150 matrix, 1960 Hz per pixel bandwidth). The average acquisition time was 45 min.
ADC measurements were recorded using regions of interest (ROIs), which were drawn on ADC maps generated automatically by the vendor software. ROIs were drawn across three separate axial images for 4 different anatomical sites in each patient (left posterior iliac crest, right posterior iliac crest, L3 lumbar vertebral body and T6 lumbar vertebral body) and a mean value for each patient was calculated. This was performed by a trainee radiologist with ROIs checked by a consultant with > 10 years’ experience in whole body MRI reporting. ROIs were preferentially drawn from contiguous sites for each anatomical site, however images degraded by artefact were avoided. Further consideration was also given to incidental observed pathology that would potentially compromise the true bone marrow ADC value. Examples of this include two cases of T6 haemangioma, one case of T6 vertebral body fracture and one case of L3 vertebral body fracture. In each instance, ROIs were drawn within the vertebral body above the level affected.
Histopathology and serum biochemistry
All corresponding marrow trephines were reviewed by a single histopathology consultant with a specialist interest in haematological malignancies who was blinded to the MRI findings. Marrow cellularity and percentage plasma cells were recorded. The marrow cellularity was reported as a ratio of the cellular fraction to the total area of the intertrabecular spaces. Normocellular was defined as 100% minus the age of the patient, with 20% of variation allowed in either direction. Values above or below this range were considered hypercellular or hypocellular respectively. International staging system (ISS) for multiple myeloma was calculated for each patient using serum beta2-microglobulin and albumin [22, 23].
Statistical analysis
Average ADC values for each anatomical location were compared using the Wilcoxon signed-rank test with p-value < 0.0125 (Bonferroni correction) taken as statistically significant. The average ADC values of all sites in each patient was correlated with age-adjusted marrow cellularity and proportion plasma cell at histopathology, as well as the international staging system (ISS) scores.
ResultsTop
A total of 68 cases were identified. Twelve cases were excluded from histopathology correlation due to > 6 weeks between bone marrow biopsy and whole-body MRI, and 8 cases were excluded from histopathology correlation due to unavailable bone marrow sample data, leaving 48 cases to be included in this study (30 male, 20 female, mean age 60.3 years, age range 41-79 years). Of these, 23 patients had a new diagnosis of myeloma and the remaining 21 were relapsed requiring treatment and 4 were suspected relapsed but did not meet criteria for treatment. Twelve regions of interest were generated for each patient (3 ROIs at 4 anatomical sites) resulting in 576 ROIs in total.
MRI
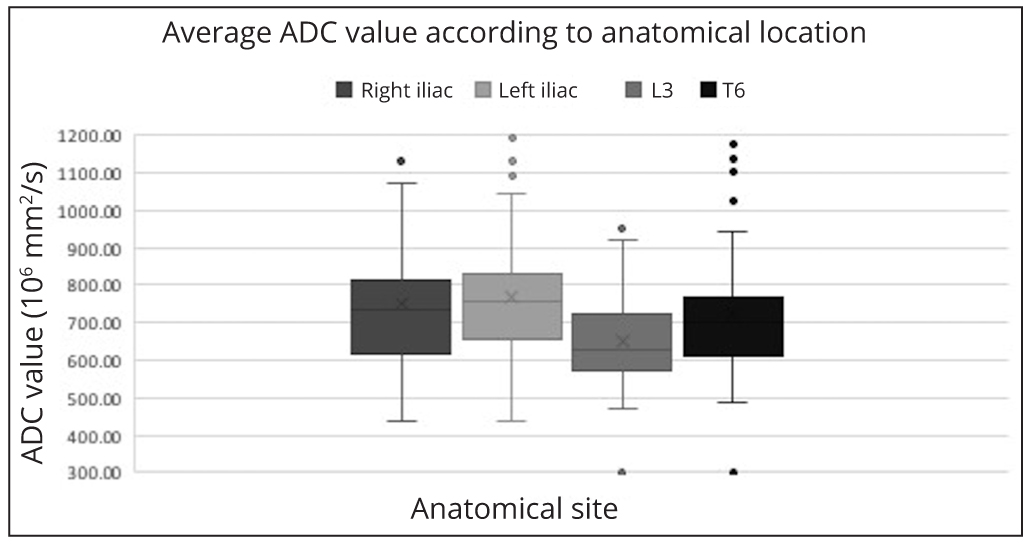
There was no significant difference in the median ADC value of bone marrow in the left ilium (754 × 10-6 mm2/s), right ilium (733 × 10-6 mm2/s) and T6 (701 × 10-6 mm2/s) but it was significantly lower in L3 (636 × 10-6 mm2/s) (p-value < 0.0125) although with overlap (Figure 1).
Histopathology and serum biochemistry correlation
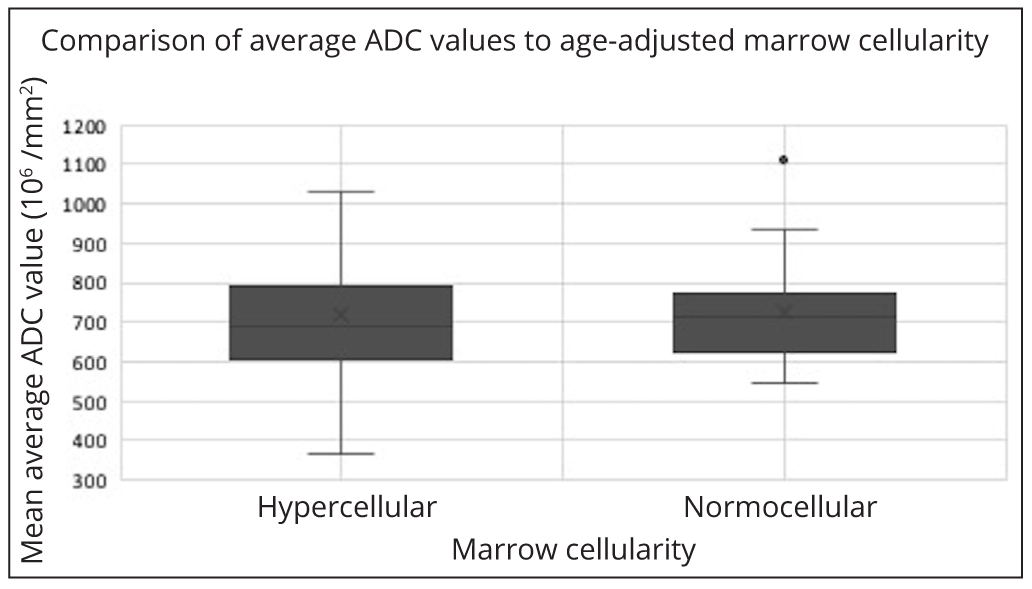
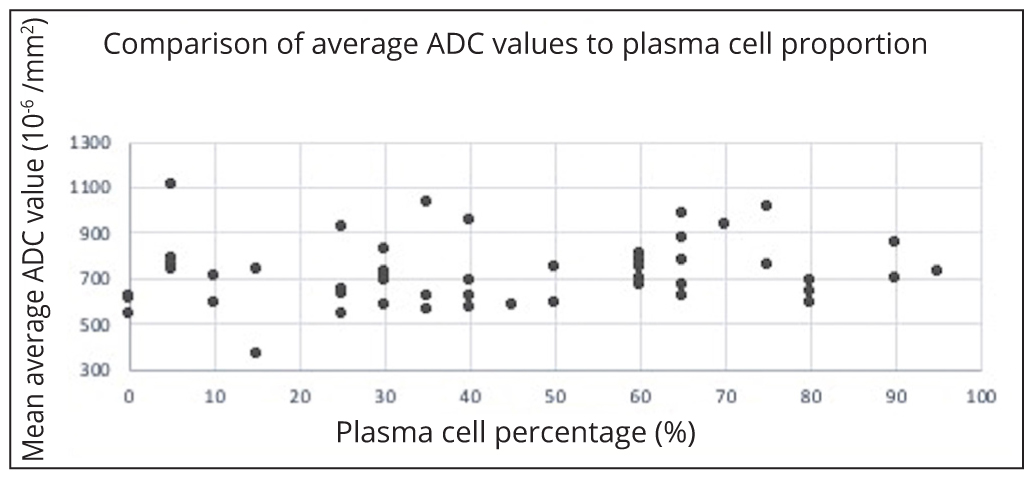
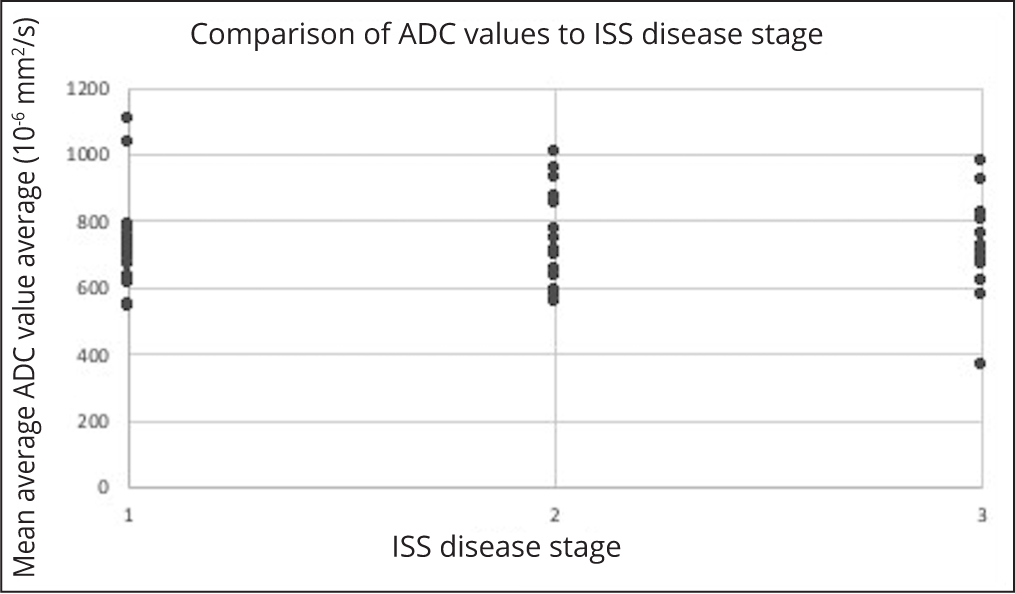
There was no correlation between per-patient average ADC values with age-adjusted marrow cellularity (p=0.7) (Figure 2), proportion plasma cells (p=0.2) (Figure 3) or ISS scores (p=0.5) (Figure 4).
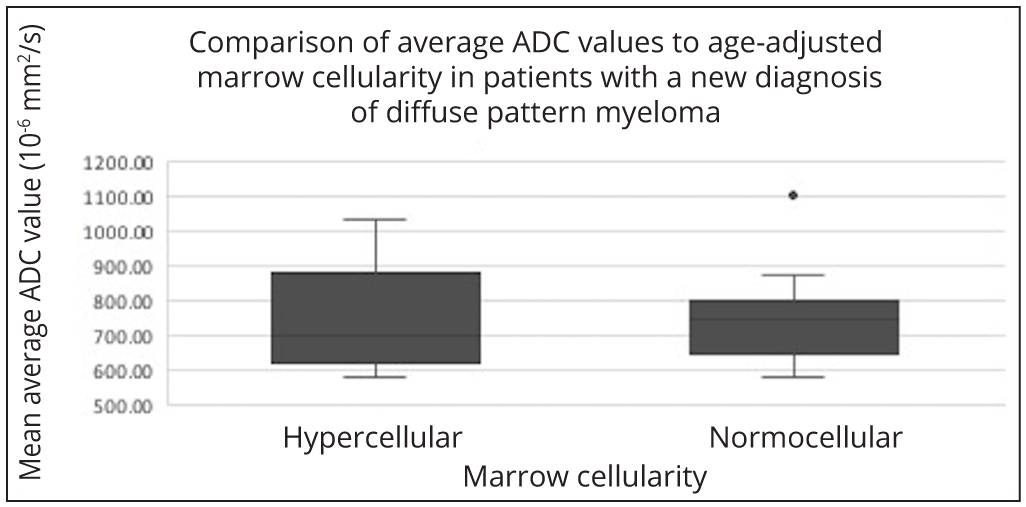
A separate analysis was performed for the 23 patients with a new diagnosis of diffuse pattern myeloma. This similarly showed no significant difference in the average ADC values when compared with age-adjusted marrow cellularity (p=0.7) (Figure 5).
DiscussionTop
There was no significant difference in ADC throughout the bony pelvis and thoracic spine in patients with active myeloma in the absence of focal lesions. Although there was a significant difference in ADC within the lumbar spine this is unlikely to be clinically meaningful as the variance of ADC measurements has been reported as high as 14.8% [24]. Therefore, untargeted posterior iliac crest sampling is likely to be representative in this patient group.
The overall mean ADC value of patients with diffuse myeloma infiltration recorded in this study, was 721 × 10-6 mm2/sec. This is comparable to 770 × 10-6 mm2/sec reported by Koutoulidis [25] but lower than 930 × 10-6 mm2/sec reported by Lacognata [26]. Koutoulidis reviewed 99 patients with newly diagnosed MM who underwent MR imaging, prior to receiving chemotherapy, using b-values of 0 s/m2, 150 s/m2, 500 s/m2 and 750 s/m2. Lacognata reviewed 10 patients with newly diagnosed diffuse MM who underwent MRI imaging, prior to receiving chemotherapy, using b-values of 50-1000 s/m2.
No correlation was shown between the bone marrow ADC values and the age-adjusted bone marrow cellularity, plasma cell proportion and ISS disease. This was also true when the bone marrow ADC values and the age-adjusted bone marrow cellularity were compared in a separate analysis using data from patients with a new diagnosis of MM only. These outcomes are conflicting with previous studies [26, 27] which demonstrated positive correlations between bone marrow cellularity and the ADC. Notable differences in approach between this study compared with studies performed by Hillengass [27] and Nonomura [28] include lack of stratification for treatment or insult relating to the bone marrow. Furthermore, none of the approaches used in either this or the comparison studies reliably accounted for variations in marrow sampling, in particular where the sample is subcortical, which would represent an area of relatively reduced cellularity.
This study was limited as a retrospective, single-centre study and as WB DWI is in its relative infancy, case numbers were limited. Adjustments for age which are standard practice for defining the marrow cellularity at our institution, may have influenced the results. Previous treatment in some patients in this series will also have been influential on pathology resulting in treatment related changes in tissue structure and composition and hence ADC measurements.
ConclusionTop
Whole body MRI is accepted as the most sensitive technique for establishing the presence of focal myeloma marrow lesions [12]. Once focal disease is excluded by MRI, our data indicate that posterior iliac crest sampling is likely to be representative. This increases confidence that the resulting percentage marrow, used to define active myeloma and relapsed myeloma, is reliable in this patient population. However, in this patient population lack of correlation of ADC with laboratory measures of disease burden suggests that previous treatments may confound the previously recognised relationship between ADC and marrow cellularity.
Conflicts of interest
The authors declare no conflicts of interest.
ReferencesTop
[1]Hillengass J, Usmani S, Rajkumar S, Durie B, Mateos M, et al. International myeloma working group consensus recommendations on imaging in monoclonal plasma cell disorders. Lancet Oncol. 2019; 20(6):e302–312.Article Pubmed
[2]Hillengass J, Fechtner K, Weber M, Bauerle T, Ayyaz S, et al. Prognostic significance of focal lesions in whole-body magnetic resonance imaging in patients with asymptomatic multiple myeloma. J Clin Oncol. 2010; 28(9):1606–1610.Article Pubmed
[3]Merz M, Hielscher T, Wagner B, Sauer S, Shah S, et al. Predictive value of longitudinal whole-body magnetic resonance imaging in patients with smoldering multiple myeloma. Leukemia. 2014; 28(9):1902–1908.Article Pubmed
[4]Kastritis E, Terpos E, Moulopoulos L, Spyropoulou-Vlachou M, Kanellias N, et al. Extensive bone marrow infiltration and abnormal free light chain ratio identifies patients with asymptomatic myeloma at high risk for progression to symptomatic disease. Leukemia. 2013; 27(4):947–953.Article Pubmed
[5]Meteos M, Hernandez M, Giraldo P, de la Rubia J, de Arriba F, et al. Lenalidomide plus dexamethasone for high-risk smoldering multiple myeloma. N Engl J Med. 2013; 369(5):438–447.Article Pubmed
[6]Moulopoulos L, Gika D, Anagnostopoulos A, Delasalle K, Weber D, et al. Prognostic significance of magnetic resonance imaging of bone marrow in previously untreated patients with multiple myeloma. Ann Onc. 2005; 16(11):1824–1828.Article Pubmed
[7]Mai E, Bertsch U, Durig J, Kunz C, Haenel M, et al. Phase III Trial of bortezomib, cyclophosphamide and dexamethasone (VCD) versus bortezomib, doxorubicin and dexamethasone (PAd) in newly diagnosed myeloma. Leukemia. 2015; 29(8):1721–1729.Article Pubmed
[8]Rajkumar S, Dimopoulos M, Palumbo A, Blade J, Merlini G, et al. International Myeloma Working Group updated criteria for the diagnosis of multiple myeloma. Lancet Oncol. 2014; 15(12):e538–548.Article Pubmed
[9]Lecouvet F, Malghem J, Michaux L, Maldague B, Ferrant A, et al. Skeletal survey in advanced multiple myeloma: radiographic versus MR imaging survey. Br J Haematol. 1999; 106(1):35–39.Article Pubmed
[10]Rasche L, Angtuaco E, Alpe T, Gershner G, McDonald J, et al. The presence of large focal lesions is a strong independent prognostic factor in multiple myeloma. Blood. 2018; 132(1):59–66.Article Pubmed
[11]National Institute for Health and Care Excellence. Myeloma: Diagnosis and Management. National Institute for Health and Care Excellence, London. Last updated: October 2018, Available via.https://www.nice.org.uk/guidance/ng35
[12]Pawlyn C, Fowkes L, Otero S, Jones J, Boyd K, et al. Whole-body diffusion-weighted MRI: a new gold standard for assessing disease burden in patients with multiple myeloma Leukemia. 2016; 30(6):1446–1448.Article Pubmed
[13]Rasche L, Angtuaco E, McDonald J, Buros A, Stein C, et al. Low expression of hexokinase-2 is associated with false-negative FDG-positron emission tomography in multiple myeloma. Blood. 2017; 130(1):30–34.Article Pubmed
[14]Sachkepedis C, Mosebach J, Freitag M, Wilhelm T, Mai E, et al. Application of 18F-FDG PET and diffusion weighted imaging (DWI) in multiple myeloma: comparison of functional imaging modalities. Am J Nuc Med Mol Imag. 2015; 5(5):479–492.Article Pubmed
[15]Messiou C, Giles S, Collins D, West S, Davies F, et al. Assessing response of myeloma bone disease with diffusion-weighted MRI. Br J Radiol. 2012; 85(1020):e1198–1203.Article Pubmed
[16]Horger M, Weisel K, Horger W, Mroue A, Fenchel M, et al. Whole-body diffusion-weighted MRI with apparent diffusion coefficient mapping for early response monitoring in multiple myeloma: preliminary results. Am J Roentgenol. 2011; 196(6):790–795.Article Pubmed
[17]Giles S, Messiou C, Collins D, Morgan V, Simpkin C et al. Whole-body diffusion-weighted MR imaging for assessment of treatment response in myeloma. Radiology. 2014; 271(3):785–794.Article Pubmed
[18]Dutoit J, Vanderkerken M, Anthonissen J, Dochy F, Verstraete K. The diagnostic value of SE MRI and DWI of the spine in patients with monoclonal gammopathy of undetermined significance, smouldering myeloma and multiple myeloma. Eur Radiol. 2014; 24(11):2754–2765.Article Pubmed
[19]Lee S, Kim H, Shin Y, Park H, Lee Y, et al. Prognostic significance of lesions and diffuse infiltration on MRI for multiple myeloma: a meta-analysis. Eur Radiol. 2017; 27(6):2333–2347.Article Pubmed
[20]Durie B, Harousseau J, Miguel J, Blade J, Barlogie B, et al. International uniform response criteria for multiple myeloma. Leukemia. 2006; 20(9):1467–1473.Article Pubmed
[21]Messiou C, Hillengass J, Delorme S. Lecouvet F, Moulopoulos L, et al. Guidelines for acquisition, interpretation, and reporting of whole-body mri in myeloma: Myeloma response assessment and diagnosis system (MY-RADS). Radiology. 2019; 291(1):5–13.Article Pubmed
[22]Durie B, Salmon S. A clinical staging system for multiple myeloma. Correlation of measured myeloma cell mass with presenting clinical features, response to treatment, and survival. Cancer. 1975; 36(3):842–854.Article Pubmed
[23]Greipp P, San Miguel J, Durie B, Crowley J, Barlogie B, et al. International staging system for multiple myeloma. J Clin Oncol. 2005; 23(15):2412–2420.Article Pubmed
[24]Messiou C, Collins D, Morgan V, Desouza N. Optimising diffusion weighted MRI for imaging metastatic and myeloma bone disease and assessing reproducibility. Eur Radiol. 2011; 21(8):1713–1718.Article Pubmed
[25]Koutoulidis V, Fontara S, Terpos E, Zagouri F, Matsaridis D, et al. Quantitative diffusion-weighted imaging of the bone marrow: An adjunct tool for the diagnosis of a diffuse MR imaging pattern in patients with multiple myeloma. Radiology. 2017; 282(2):484–493.Article Pubmed
[26]Lacognata C, Crimi F, Guolo A, Varin C, De March E, et al. Diffusion-weighted whole-body MRI for evaluation of early response in multiple myeloma. Clin Radiol. 2017; 72(10):850–857.Article Pubmed
[27]Hillengass J, Bauerle T, Bartl R, Andrulis M, McClanahan F, et al. Diffusion‐weighted imaging for non‐invasive and quantitative monitoring of bone marrow infiltration in patients with monoclonal plasma cell disease: a comparative study with histology. Br J Haematol. 2011; 153(6):721–728.Article Pubmed
[28]Nonomura Y, Yasumoto M, Yoshimura R, Haraguchi K, Ito S, et al. Relationship between bone marrow cellularity and apparent diffusion coefficient. J Magn Reson Imaging. 2011; 13(5):757–760.Article Pubmed
 Copyright
© 2012-2019 NobleResearch Group. All Rights Reserved
Copyright
© 2012-2019 NobleResearch Group. All Rights Reserved