


- Download PDF
- |
- Download Citation
- |
- Email a Colleague
- |
- Share:
-
- Tweet
-
Journal of Radiology and Imaging
Volume 4, Issue 6, September 2020, Pages 40–44
MethodologyOpen Access
Denoising COVID-19 computed tomography scans with scalable open source software
-
Trevor Grant1,*

*Corresponding author: Trevor Grant, Head of Research, Aboriginal Armadillo, LLC., Chicago, IL 60647, USA. E-mail: trevor.d.grant@gmail.com
Received 1 July 2020 Revised 28 August 2020 Accepted 7 September 2020 Published 18 September 2020
DOI: http://dx.doi.org/10.14312/2399-8172.2020-6
Copyright: © 2020 Grant T. Published by NobleResearch Publishers. This is an open-access article distributed under the terms of the Creative Commons Attribution License, which permits unrestricted use, distribution and reproduction in any medium, provided the original author and source are credited.
AbstractTop
Computed tomography (CT) scans have been shown to be better detectors of COVID-19 than the traditional reverse-transcription polymerase chain reaction (RT-PCR) test, especially at early stages of infection. The radiation dose associated with a thorax CT scan is high. A low dose method of CT scans exists, but resultant image quality is markedly lower than a traditional scan. We present a method for denoising CT scan images based on scalable open source software. We find our method performs “well enough”, considering our aims to create a production application with “off-the-shelf” components, but would like to do follow on research comparing it to other denoising methods. We would also like to combine our results with other research to create a COVID-19 detection test, which is entirely automated and based on CT scans only.
Keywords: denoising; COVID-19; CT scans; scalable open source software
BackgroundTop
The severe acute respiratory syndrome coronavirus 2, also known as coronavirus disease-2019 (COVID-19), was first identified in Wuhan, China in December of 2019 and quickly escalated into a global health concern. It was declared a pandemic by the World Health Organization (WHO) on March 11th, 2020 [1].
The most common symptoms of COVID-19 are fever, cough, and fatigue. Clinical features in Computed tomography (CT) scans present as pneumonia with abnormalities including ground-glass opacities, RNAaemia, acute respiratory distress syndrome and others [2].
Currently, COVID-19 is best detected using a combination of reverse-transcription polymerase chain reaction (RT-PCR) and CT scans. CT scans have been shown to be an effective primary tool for detecting COVID-19 and show higher sensitivity for diagnosis of COVID-19 compared to RT-PCR [3].
It has also been shown that while RT-PCR may be negative for early onset patients, CT scans may be more effective in detecting the presence of the disease [3]. Bernheim et al outline observations of how features of CT scan change with the number of days since onset [4].
CT scans use X-rays from many angles to produce tomograms or “cross sectional slices” of scanned areas. The National Research Council recommends limiting lifetime diagnostic radiation exposure to 100 mSv (milliSieverts) [5], which is approximately twenty five chest scans. The elderly and patients with pre-existing health conditions are more likely to be close to the diagnostic exposure limit due to prior CT scans. Unfortunately these are the same high risk for complications with COVID-19.
Normal chest scans deliver a dose of approximately 7 mSv, but low dose chest scans typically deliver between 1.5 and 2 mSv [6]. There is an inherent trade off in the between image quality and radiation dose from the X-rays (higher radiation dose yields higher quality images) [7]. The significant reduction in radiation from low dose CT scans has led to substantial research in the field of denoising low dose CT scans. It is therefore desirable to perform the lowest dose CT scan possible that will still yield a CT scan which will allow the physician to make an accurate diagnosis, and the required dose grows lower as denoising technology improves.
We propose a method for denoising CT scans of COVID-19 patients which is low cost, well supported, and can be deployed anywhere. We achieve these aims by building our solution with popular, scalable, open-source components. This has the added benefits of being quickly, easily, and affordably deployable to production grade environments.
We utilize Apache Mahout’s distributed stochastic singular value decomposition (DS-SVD) function for our denoising. Apache Mahout is a library for Apache Spark, which allows us to spread calculating the SVD of a single matrix over multiple machines. Kubernetes is an orchestration layer that may be deployed locally, on-premise, or in any of the major cloud providers, and can give us the “multiple machines” which Spark will use. Finally, we also use Kubeflow, a Machine learning pipeline framework, so that our experiments can easily be recreated by other researchers with minimal effort.
Our solution can be quickly and easily deployed to production environments creating applications that will allow physicians to order low dose CT scans as a complimentary or even primary method for testing COVID-19 especially in situations where RT-PCR tests are unavailable or being rationed.
MethodTop
When denoising an observed image y, what we observe is a composition of some clean image x and some “noise” v as the following equation [8].
y = x + y
Thus, “denoising” is simply solving the above formula for x. There are several methods for denoising covered in the computer imaging, radiological and signal processing, as well as other fields. Unfortunately, this leads to differing terminology for similar concepts.
The denoising problem is an important one for many applications beyond CT scans. Many approaches have been proposed over the last 50 years including, but not limited to, a plethora of statistical techniques, spatial adaptive filters, convolutional neural nets, and more. We do not attempt to provide a survey of this field.
In traditional singular value decomposition (SVD) we attempt to find:
A = UΕVT
Where U and V are our left and right singular vectors, Ε is our diagonal matrix of singular values and, in our case, A is our original three dimensional image “flattened” to two dimensions. Image denoising with traditional SVD then is very straightforward. We find the smallest singular values in Ε and set them to zero, which then yields “cleaner” images.
To give an example of why we cannot denoise images with a traditional SVD: when attempting to do so on a CT scan with the popular Python package scipy, an error was thrown indicating that 512GB of memory was needed to complete the operation. At the time of writing, the largest EC2 instances on Amazon are capped at 394GB of memory. Top of the line modern servers have a terabyte or more of memory, however these are unavailable to most researchers. We seek a method to approximate SVD results with lower requirements.
Aharon et al [9] used a K-means based method to approximate SVD (K-SVD), which they use to find basis vectors to construct X; Chen also noted that K-SVD, while more robust to noise, is very computationally expensive [10].
We have chosen to use distributed stochastic singular value decomposition for three reasons. First, the results are well understood, and similar to K-SVD (which was more robust to noise, but computationally expensive). Second, it is available “out of the box” with Apache Mahout, thus allowing researchers and practitioners to quickly deploy models based on our work for fighting the COVID-19 pandemic. Third, it runs on Apache Spark, which can be scaled such that it is computationally trivial to compute the singular value decomposition even for very large images such as three dimensional CT scans.
The details of randomized methods for low-rank matrix approximations are well covered by Halko [11]. Apache Mahout’s implementation and minor changes to Halko’s original algorithm are likewise in Lyubimov and Plumbo [12]. The pseudo-implementation and a brief discussion (reproduced from the book with the author’s permission) is provided at the Apache Mahout website [13]. There are, however, a few salient points unique with this approach to which we call attention.
As a stochastic process, we estimate vectors that will span the entire column space of the “signal” of the target matrix (our original image). Since a noise component is present, it is possible that this noise will prevent our estimated vectors from completely scanning the signal matrix. Halko has shown [11], and Lyumbimov and Palumbo [12] anecdotally confirm that a small number of additional estimated vectors will significantly improve the accuracy in capturing the column space of the “signal” matrix.
The signal matrix values are updated by first computing, then Y = ABT finding the orthonormal matrix Q from Y = QR, and finally calculating the updated signal matrix B ← QTA. The “power iterations” specify how many additional times this will happen (by default it happens just once).
Lyumbimov and Palumbo [12] state that the first additional power iteration can significantly increase accuracy but at the cost of potentially doubling calculation time, they question whether subsequent power iterations are worth the further increase in accuracy.
By convention, singular values (Ε) are often sorted from greatest to least. The entire sequence of singular values is known as the “spectrum”. The decrease among the spectrum values is known as spectrum decay. Lyumbimov and Palumbo note that the spectrum decay between the first singular value and the k + 1 th singular value should not exceed two orders of magnitude. From this guidance we can numerically deduce our optimal rank k, under the assumption that computational cost to us is minimal compared to time and output of an enhanced image, i.e. we run the algorithm once at a very high value of k , note the spectrum, and then run it again under optimized k.
ResultsTop
We leverage Kubeflow so that others may rapidly iterate on our work. When we speak of steps, we are referring to Kubeflow Pipelines steps. The source code may be found at website [14].
In the first step we download our data. Drawing from what has been submitted by Omir Antunes Paiva to coronacases.org, we collected ten Chinese patients to use as a sample. Each case has a collection of DICOM images from the axial, coronal, and sagittal perspectives. While we cannot confirm these patients actually have tested positive for COVID, we can confirm that these DOCIM image files are valid, and any researcher may substitute in their own DICOM images to verify our results or create better ones. We did this to ensure that our “clean” images can more clearly see the “ground-glass opacities” in lungs, which are present in these images.
Other researchers may wish to substitute their own data or to use this method for other low dose CT scans. The Radiological Society of North America has recently announced they will be compiling a repository of CT scans of COVID-19 patients, and we will reference this repository in future work.
In the second step we load the DICOM image. While any DICOM would work, we arbitrarily chose an axial perspective where each slice is 512×512 by 301 slices. We convert this into a tensor of dimension 512×512×301. The three dimensional tensor is then “flattened” into a two dimensional matrix of size 262144×301. The resulting matrix is dense and 2GB on disk.
Note that the column space of the flattened matrix is equal to the number of slices, or the third dimension in the previous tensor. This is by design. An image of different dimensions or number of slices will still process correctly.
In the third step, this matrix is loaded in an Apache Spark application with Apache Mahout and the DS-SVD is performed. The resulting U, V matrices are saved as are the singular values of Ε.
On our first pass, we see the two orders of magnitude drop in spectrum decay occurs around. We also decide to run with two additional k = 244 power iterations.
We see four images of the lungs of a COVID-19 positive patient (Figure 1) all taken at the 225th of 512 slices from the aspect of the axial plane.
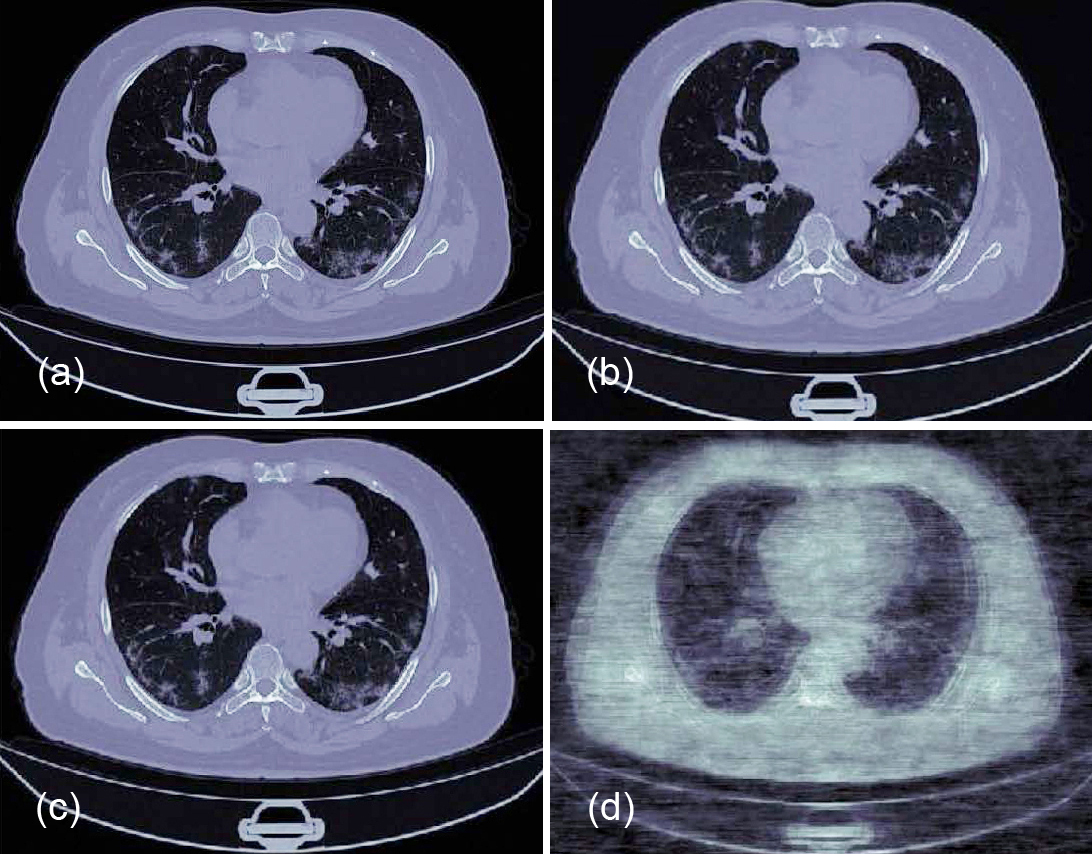
From the above, we can clearly see that using too few basis vectors (k=50), clearly has detrimental effects on the recomposed image. As Lyubimov and Palumbo [12] indicated, k=244 does seem sufficient, and little is gained in clarity of reconstructed image between k=244 and k=300.
Next we will examine the effects of denoising, using the k=244 run of the DS-SVD. We will denoise at levels of 0.1%, 1%, 5%, 10%, and 30% and observe how the image changes (Figure 2). We do this by setting the last n % of the singular values equal to zero (By convention singular values are arranged in order of largest to smallest, and so the last n % is least important to the recomposed image and most likely to be noise).
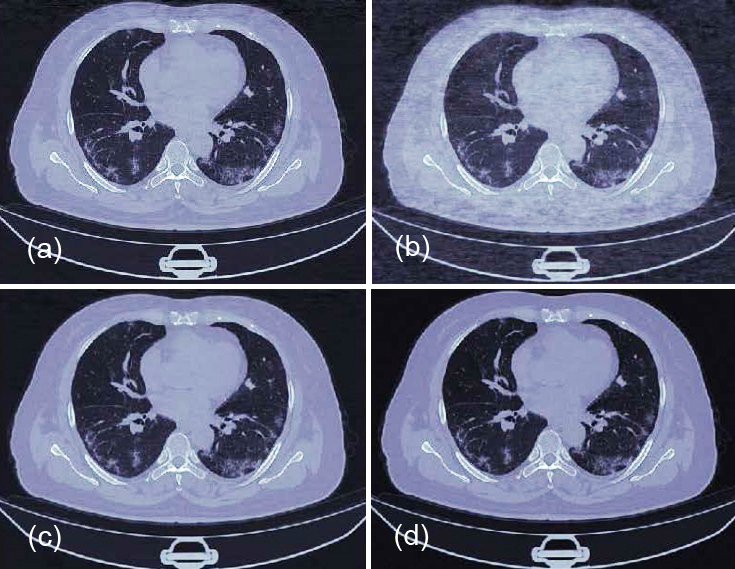
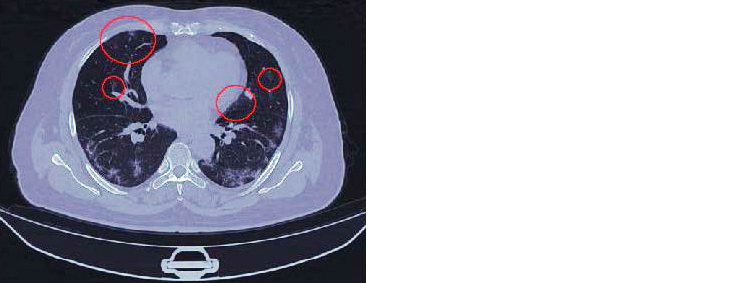
In the above examples, we see little difference between 0.1% denoising and the original. We do see a marked improvement in the 1-5% range however. In addition to the opacities towards the rear of the patient (Figure 3) becoming more prominent as denoising increases, we see small previously unobserved opacities towards the front of the patient also coming into clearer view.
As each CT scan will be different and have different noise patterns associated with it, we expect that the optimal level of denoising will vary by CT scan and by practitioner inspecting the CT scans. Fortunately, changing percent of denoising at this point can be done easily on a laptop and new images can be rendered in a matter of seconds.
Future workTop
The Radiological Society of North America has recently announced they will be compiling a repository of CT scans of COVID-19 patients to make openly available to practitioners and researchers fighting the pandemic. The goal of the data repository is both educational and to support researchers [15]. Additionally, the “Imaging COVID-19 AI initiative” is a European initiative, explicitly calling for AI researchers to assist in the detection, and treatment of COVID-19 based on CT scans [16]. The imaging COVID-19 AI initiative also hopes to publish repositories soon. We hope to apply and fine tune this technique as larger CT scan datasets come online.
Traditionally papers on denoising techniques evaluate the effectiveness of their technique compared to others with simple tests such as adding white noise to a known image and then measuring how close the denoised image was to the original. Our goal was not to create a “best in class” image denoising algorithm but to prove a “good enough” application with existing methods in production grade open source libraries so that clinicians can quickly begin utilizing this technique in the field to fight the current COVID-19 pandemic. We would however like to compare this method to existing techniques to compare efficacy.
Opacities in a CT scan with a negative RT-PCR test would simply be treated like regular pneumonia, and possibly confirm a need for antibiotics more than anything. We believe however, by combining results with a deep learning approach similar to Li et al [17], might yet yield a useful COVID-19 early detection algorithm based solely on CT scans.
Li et al [17] had access to a dataset of over 3300 patients, almost 1300 of which had tested positive for COVID-19 by means of (RT-PCR). Training a ResNet50 convolutional neural network (CNN), they were able to distinguish between commonly acquired pneumonia and COVID in patients with great success. A follow-up study of interest would be repeating their research with denoised images (they did minimal preprocessing).
ConclusionTop
We have presented a method for denoising large 3D images that is functional, and based on methods currently in existing open source projects which can be deployed at scale immediately for enhancing low dose CT scans to support the early detection of coronavirus and to support further research with the same aims.
Conflicts of interest
Authors declare no conflict of interest.
ReferencesTop
[1]World Health Organization. WHO Director-General's opening remarks at the media briefing on COVID-19 - 11 March 2020. Accessed from:https://www.who.int/dg/speeches/detail/who-director-general-s-opening-remarks-at-the-media-briefing-on-covid-19---11-march-2020
[2]Rothan HA, Byrareddy SN. The epidemiology and pathogenesis of coronavirus disease (COVID-19) outbreak. J Autoimmun. 2020; 109:102433.Article Pubmed
[3]Ai T, Yang Z, Hou H, Zhan C, Chen C, et al. Correlation of chest CT and RT-PCR testing for coronavirus disease 2019 (COVID-19) in China: A report of 1014 cases. Radiology. 2020; 296(2):E32–E40.Article Pubmed
[4]Bernheim A, Mei X, Huang M, Yang Y, Fayad ZA, et al. Chest CT findings in coronavirus disease-19 (COVID-19): Relationship to duration of infection.Article Pubmed
[5]Health Risks from Exposure to Low Levels of Ionizing Radiation: BEIR VII Phase 2 . Washington: National Academies Press, 2006.Article Pubmed
[6]Larke FJ, Kruger RL, Cagnon CH, Flynn MJ, Mcnitt-Gray MM, et al. Estimated radiation dose associated with low-dose chest CT of average-size participants in the national lung screening trial. Am J Roentgenol. 2011; 197(5):1165–1169.Article
[7]Goldman LW. Principles of CT: Radiation dose and image quality. J Nucl Med Technol. 2007; 35(4):213–225.Article Pubmed
[8]Michael E, Aharon M. Image denoising via sparse and redundant representations over learned dictionaries. IEEE Transactions on Image Processing 2006; 15(12):3736–3745.Article
[9]Aharon M, Elad M, Bruckstein A. K-SVD: An algorithm for designing overcomplete dictionaries for sparse representation. IEEE Transactions on Signal Processing 2006; 54(11):4311–4322.Article
[10]Chen Y, Yin X, Shi L, Shu H, Luo L, et al. Improving abdomen tumor low-dose CT images using a fast dictionary learning based processing. Physics in Medicine and Biology. 2003; 58(16):5803–5820.Article
[11]Halko NP. Randomized methods for computing low-rank approximations of matrices . A thesis submitted to the Faculty of the Graduate School of the University of Colorado in partial fulfillment of the requirements for the degree of Doctor of Philosophy Department of Applied Mathematics 2012.Article
[12]Lyubimov D, Palumbo A. Apache Mahout, Beyond MapReduce: Distributed algorithm design. 2016.
[13]Apache Mahout. Distributed stochastic singular value decomposition. Accessed on April 15, 2020 from:https://mahout.apache.org/docs/latest/algorithms/linear-algebra/d-ssvd.html
[14]Accessed from:https://github.com/rawkintrevo/basis-vectors-for-covid-kf
[15]Rsna. RSNA announces COVID-19 imaging data repository. Accessed on April 15, 2020 from:https://press.rsna.org/timssnet/media/pressreleases/14_pr_target.cfm?ID=2167
[16]Imaging COVID-19 AI Initiative. Accessed on April 15, 2020 from:https://imagingcovid19ai.eu/
[17]Li L, Qin L, Xu Z, Yin Y, Wang X, et al. Artificial intelligence distinguishes COVID-19 from community acquired pneumonia on chest CT. Radiology. 2020; 296(2):E65–E71.Article Pubmed
 Copyright
© 2012-2019 NobleResearch Group. All Rights Reserved
Copyright
© 2012-2019 NobleResearch Group. All Rights Reserved